


Retail demand forecasting: Getting started
Both out-of-stocks (OOS) and overstocks are expensive. They lead to missed sales, price markdowns, waste, and urgent orders or expedited shipments. Retail demand forecasting is how you estimate what shoppers will purchase at the store and item level, so you can order and replenish more accurately. Most teams already have a forecasting model, but it won’t perform well when POS, inventory, and promo data aren’t cleaned or aligned.
The good news is that you can often improve accuracy by improving your data inputs. Start with a clean and up-to-date POS and inventory data, and consistent store and item definitions. Then, set a repeatable cadence for reviewing the forecast and acting on it.
In this guide, you’ll learn how to set up that foundation: how to separate sales from demand, what level of detail you need, which data sources to bring together, and what to measure so forecasting improves on-shelf availability and improves inventory health over time.
Key takeaways:
- Separate demand from sales: Sales records show what you sold. Demand includes what you missed when items weren’t available.
- Forecast at the store and item level: That’s where ordering and replenishment decisions are made and where demand swings show up first.
- Fix data quality first: Forecasts slip when POS, inventory, and promotion data aren’t clean or aligned.
- Plan for uneven selling patterns. Many items sell in bursts, especially slow movers and promo-driven lines.
- Measure impact in availability and inventory health. Look for stronger on-shelf availability (OSA), fewer stockouts, and healthier on-hand.
- Share data to prevent overcorrection: When retailers and suppliers work from the same current POS and inventory data, forecasts and orders stay closer to true demand.
In this guide, you’ll learn how to set up that foundation: how to separate sales from demand, what level of detail you need, which data sources to bring together, and what to measure so forecasting improves on-shelf availability and improves inventory health over time.
The difference between Sales Forecasting and Demand Planning
Before you choose a model or start aggregating data, it’s important to be clear about what you’re trying to forecast. Sales forecasting and demand planning are related, but they answer different questions, and confusing the two is a common source of error.
Sales forecasting looks at what you expect to sell given real-world constraints. It reflects current inventory levels, ordering policies, lead times, and budget limits. For retailers, that often means forecasting orders and expected inventory arrivals. For brands, it may mean forecasting customer orders or shipments. In both cases, sales forecasts describe what is likely to move given today’s conditions.
Demand planning, on the other hand, focuses on what shoppers actually wanted to buy in the moment they were ready to purchase – whether that’s in a store aisle or on a product page online. It answers the question, “If we had unlimited inventory and perfect distribution, how much would consumers buy?”
Why the distinction matters: Using sales history alone to predict future demand can create an inaccurate feedback loop. If an item was out of stock for three days last month, your sales data will show three days of zero units sold. If you feed those zero units sold into a forecast model without correction, the forecast is pulled down. The next order or allocation is smaller, and the item is more likely to go out of stock again. Over time, the forecast keeps learning from stockouts instead of the demand that was actually there.
Using sales history alone to predict future demand can create an inaccurate feedback loop. If an item was out of stock for three days last month, your sales data will show three days of zero units sold. Over time, the forecast keeps learning from stockouts instead of the demand that was actually there.
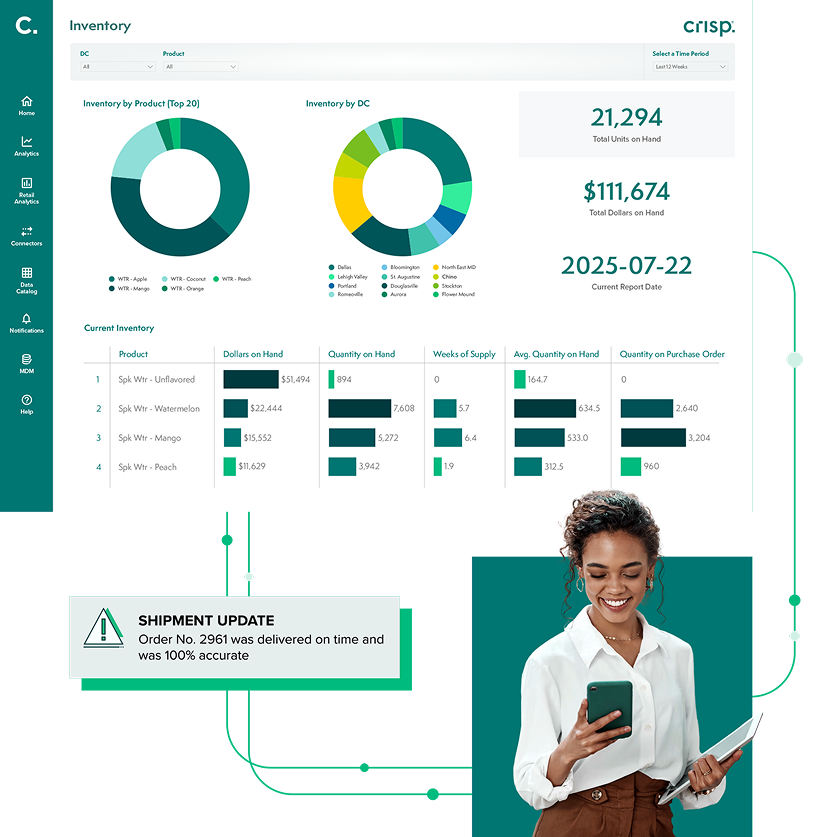
Accurate inventory tracking with real-time data
Establishing the right granularity
A common mistake when getting started with demand forecasting? Relying on averages. It’s tempting to look at monthly sales per region or weekly sales by retailer. Those views are useful for reporting, but they can hide the store-level swings that drive out-of-stocks and overstocks..
In real life, demand shows up at a specific store, for a specific item, on a specific day. That’s also where the most important decisions get made: ordering, replenishment, and allocation. When you only forecast at a high level, you miss pockets of demand and early warning signs that shelves are about to go empty in certain locations.
That’s why store- and item-level forecasting is worth the effort. It gives brands and retailers a clearer view of where demand is building, where inventory is getting tight, and where action is needed before a stockout or markdown hits.
The intermittency challenge
Intermittency means sales aren’t steady day to day. Once you move to store-by-item detail, it’s normal to see many days with no sales for certain items at certain stores. That doesn’t always mean no demand. It often means the item sells in bursts, or only when conditions are right. It matters because a single “average daily sales” number can mislead you. If an item sells four units on Saturday and zero the rest of the week, an average suggests a small, steady trickle. But replenishment decisions don’t work that way. Teams need to plan for the next real selling day, not a fractional number.
A practical way to handle intermittency is to segment your approach by velocity. High-velocity items (like milk or bread) behave more predictably and benefit from tighter, short-horizon forecasting (focused on the next few days or weeks). Lower-velocity items (such as specialty spices or seasonal décor) require methods that account for bursts of demand and longer periods between purchases. The goal isn’t to force every item into the same pattern. It’s to use an approach that matches how the item actually sells.
In real life, demand shows up at a specific store, for a specific item, on a specific day. That’s also where the most important decisions get made: ordering, replenishment, and allocation.
Building the data foundation
Forecasting problems are usually not math problems. They are data problems: missing history, late updates, and no context around what happened in the market. Before you worry about models, you need a data foundation built on three key inputs.
POS and inventory data
Point-of-sale (POS) data shows what shoppers actually bought. It’s the clearest signal of consumer demand. Order, shipment, or receipt data reflects how inventory moves through the supply chain, but it doesn’t tell you what happened at the shelf. To understand true demand, you need access to daily store-level POS data.
POS data alone isn’t enough. You also need inventory on hand. If sales dropped to zero, you need to know why. Was demand soft or was the product out of stock? Without inventory context, those two situations look identical in the data, and forecasts can’t tell the difference. Pairing POS with inventory levels enables teams to flag periods when an item was unavailable. Those days shouldn’t be treated the same as days when the product was fully stocked. Adjusting for stockouts helps forecasts reflect what shoppers were trying to buy, not just what was available on the shelf.
In practice, POS and inventory data often live across multiple retailer systems and portals. Bringing them together in a consistent format is a critical step toward reliable forecasting.
Calendar and event drivers
Retail demand follows the calendar. Weekends, holidays, SNAP benefit distribution days, and pay cycles all influence when shoppers buy. Promotions add another layer, creating spikes that are real, but not always repeatable.
That’s why it helps to maintain a clear record of events and promotions. If a past Buy One Get One (BOGO) promotion isn’t flagged, a forecast may misread the lift as a lasting change. When the promotion ends, you can end up with too much inventory in the wrong places.
Supply chain and distribution
Once internal data is clean, external factors can add useful context. Weather is the most obvious variable. A heatwave can raise demand for ice cream but suppress demand for soup.
Start simple. Identify categories that are clearly weather-sensitive. Then test whether temperature or precipitation improves your forecast. External data works best as a refinement on top of solid POS, inventory, and event context – not a substitute for them.
If sales dropped to zero, you need to know why. Was demand soft or was the product out of stock? Without inventory context, those two situations look identical in the data, and forecasts can’t tell the difference.
Improve supplier performance
Metric selection: How to measure success
You get what you measure. If you only score forecasting on a single ‘accuracy’ number, teams can end up optimizing for the metric instead of the outcome. In retail, the outcome is simple: keep product available without building excess inventory.
Here are the measures that tend to matter most when you’re getting started.
On-shelf availability and stockouts
If a shopper can’t find the product, the forecast didn’t do its job, even if it looks ‘accurate’ on paper. Track on-shelf availability (OSA) where you can, and use out-of-stock rates as a practical proxy when you can’t. This keeps forecasting tied to the customer experience and to revenue.
Inventory on-hand and inventory health
Forecasting should help teams hold the right inventory in the right places. Inventory on hand (IOH) helps you see whether you’re too tight (risking stockouts) or too heavy (setting up price markdowns and waste). It also helps explain what sales alone can’t: whether low sales reflect low demand or low availability.
Forecast bias (over- and under- forecasting)
Instead of obsessing over perfect precision, watch for consistent over-forecasting or under-forecasting. A forecast that is accurate on average can still be harmful if it repeatedly pushes teams toward over-ordering in some locations and under-ordering in others.
A simple way to start is to review a short list of items each week: where did we overshoot, where did we undershoot, and what was different about those stores or weeks (in-stock status, promotion timing, weather, distribution)?
Performance by item velocity
High velocity items and slow movers behave differently, so measure them differently. For fast movers, small misses can quickly lead to stockouts. For slow movers, one extra case can turn into weeks of excess. Segment your reporting by velocity so teams aren’t forced into the same target for every item.
A forecast that is accurate on average can still be harmful if it repeatedly pushes teams toward over-ordering in some locations and under-ordering in others.
Common pitfalls to avoid
As you put a forecasting process in place, a few predictable issues tend to show up. Avoiding them early will save time and prevent a lot of rework later.
The bullwhip effect
Small changes in shopper demand can turn into much larger changes in orders, inventory, and production as they move up the supply chain. A modest shift at the shelf can lead to much larger changes in orders, inventory positioning, and production plans as each layer buffers ‘just in case.’
This is known as the bullwhip effect. One of the simplest ways to reduce this is to plan from shopper signals when possible. POS data reflects what consumers actually bought. Order and shipment patterns reflect buying cycles, minimums, and batch behavior, which can exaggerate peaks and valleys. When forecasting starts with POS and is checked against inventory and availability, teams tend to make smaller, steadier adjustments.
Overcomplicating AI-driven forecasting too early
When your forecasting results aren’t where you need them, it’s easy to jump straight to a more advanced model. However, the more automated the approach, the more the foundation matters. If POS, inventory, and promotion data aren’t clean, consistently defined, and aligned across systems, added complexity can increase the noise instead of reducing it.
Start by strengthening your base: up-to-date data, consistent item and store definitions, and standardized business logic that teams agree on. That structure makes forecasts easier to trust, easier to explain, and easier to automate at scale. For a deeper look at why data quality and a semantic layer matter for AI-driven forecasting, see this article on closing the loop with AI in supply chain planning.
Master data management (MDM) ensures that product attributes, dimensions, and hierarchies are accurate. If the master data is flawed, the analytics will be misleading.
Grow retail revenue with real-time data
Technology’s role in scaling forecasts
Spreadsheets can work when you’re forecasting at a high level like total sales by week or month. They become hard to maintain once you’re forecasting at the store and item level. Even a small SKU list across a large store footprint creates thousands of store-item forecasts to update, review, and explain every week. That’s where the right tech stack can help. To run demand forecasting across more items and stores, teams need automated data ingestion and normalization, so POS, inventory, and promotion data arrives in a consistent format. Crisp helps by connecting directly to retailer and distributor portals and delivering clean, up-to-date data into the tools teams already use, or into cloud warehouses like Snowflake and Google BigQuery.
Automation also reduces the manual work that slows teams down. Instead of spending hours downloading reports, fixing formatting, and reconciling mismatched definitions, planners can focus on the work that changes decisions: investigating exceptions, understanding why forecasts moved, and acting earlier when inventory is getting tight. Over time, that shift makes forecasting easier to run week after week across more items and more locations, without adding headcount.
Conclusion
Getting started with retail demand forecasting comes down to doing a few basics well. Start with store-level POS and inventory on hand, make sure those inputs line up, and build a process your team can run consistently.
Don’t try to forecast every item in every store on day one. Start with one category, one retailer, or one region. Check that the data is complete and consistent, then establish a baseline forecast you can explain and defend. Track whether it’s helping you keep products on the shelf, reduce stockouts, and avoid excess on-hand.
When the foundation is solid, improving accuracy becomes an ongoing discipline instead of a one-time project. That’s what allows teams to spot issues earlier and make better decisions before they show up as lost sales, markdowns, or waste.
FAQs about retail demand forecasting
-
What is the best time horizon for retail demand forecasting?
It depends on the decision you’re trying to support. For replenishment and day-to-day execution, shorter horizons are most useful – often the next one to four weeks, at daily detail. For longer-range planning like production, capacity, or raw material buys, teams usually look further out (roughly three to 18 months) and work at a weekly or monthly rollup.
-
How do I handle demand forecasting for new product launches?
New items don’t have history, so you start with a “closest match” approach. Pick a similar product (or a small set of similar products) and use its early sales pattern as a starting point. Then adjust based on what’s different about the launch: distribution, pricing, promotion support, seasonality, and whether it’s replacing an existing item.
-
Why is my forecast accuracy lower for slow-moving products?
Slow movers don’t sell in steady daily patterns, so percentage-based accuracy can be misleading. If an item sells one unit in a week and you miss by one, that shows up as a large error even though the business impact may be limited. For these items, it’s often more useful to track whether you’re consistently over- or under-forecasting and whether you’re holding the right on-hand levels, rather than chasing perfect precision.
-
Should I use shipment data or POS data for forecasting?
Use point-of-sale (POS) data whenever possible because it reflects what shoppers actually purchased. Shipment data and syndicated market reports are useful context, but they don’t tell you what happened at the shelf or on the product page on a given day. They’re shaped by ordering cycles, minimums, forward buys, and inventory buffering.
-
How does out-of-stock data improve forecasting?
Out-of-stock (OOS) data allows you to interpret sales correctly. When sales drop to zero, you need to know whether demand slowed down or the product wasn’t available. Pairing POS with inventory on hand lets you flag stockout periods so they don’t pull the forecast down. That helps the forecast reflect what shoppers were trying to buy, not just what the shelf allowed.
Get insights from your retail data
Crisp connects, normalizes, and analyzes disparate retail data sources, providing CPG brands with up-to-date, actionable insights to grow their business.