


CPG guide to retail data analytics strategy
Retailers and CPG brands collect a lot of data, but it’s still hard to act on. With sales happening across stores and e-commerce, and supply chains under pressure, teams need a reliable way to connect point-of-sale (POS), inventory, and online sales data. Without that, the same issues keep repeating: stockouts, excess inventory, and time spent explaining what happened after the fact.
This article explains what a modern retail analytics strategy looks like. You’ll learn how to align disconnected data across systems, which use cases deliver the biggest value, and what needs to be in place so insights are accessible to the teams making decisions.
Key takeaways:
- Unified data comes first: You can’t analyze what you can’t see. The first hurdle is bringing data from different retailer portals into one harmonized model.
- Late data kills ROI: Weekly reports are too slow for modern supply chains. Daily (or near real-time) updates are what helps teams to address prevent stockouts and reduce spoilage.
- Availability is the metric that moves revenue: Focus on lost sales due to out-of-stocks is one of the fastest ways to revenue recovery.
- Governance enables scale: Clear data quality standards and privacy frameworks keep reporting trustworthy and make advanced analytics and AI workable.
This article explains what a modern retail analytics strategy looks like. You’ll learn how to align disconnected data across systems, which use cases deliver the biggest value, and what needs to be in place so insights are accessible to the teams making decisions.
The operational case for deep retail analytics
The retail environment has shifted from a store-centric model to a complex omnichannel ecosystem. According to the U.S. Census Bureau (seasonally adjusted), e-commerce accounted for 16.4% of total retail sales in the third quarter of 2025. This shift forces brands to track inventory and sales across digital and physical shelves simultaneously, often with different data standards for each.
The cost of poor visibility is rising sharply. For example, in its 2024 report, the National Retail Federation (NRF) shared that retailers reported a 93% increase in the average number of shoplifting incidents in 2023 vs. 2019. Without granular data analytics, it’s harder to tell what actually sold versus what was lost to shrink, among other supply chain issues, or reporting issues.
Furthermore, the reverse logistics loop has grown into a massive financial drain. Appriss Retail estimates that total U.S. consumer returns reached $685 billion in 2024, representing just over 13% of total retail sales. A strong analytics program helps you understand why returns happen, spot patterns that may signal fraud, and find supply chain issues that quietly erode margin.
The shift to omnichannel commerce forces brands to track inventory and sales across digital and physical shelves simultaneously, often with different data standards for each.
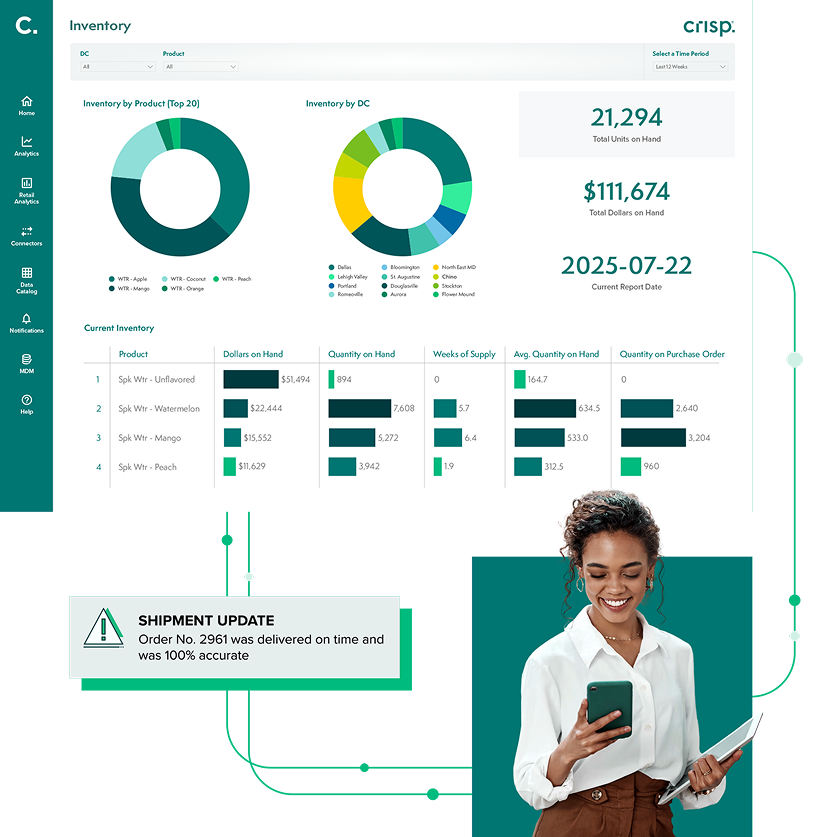
Accurate inventory tracking with real-time data
Building the retail data foundation
Before a team can optimize pricing or forecast demand, they must solve two foundation problems: getting the data out of retailer portals automatically (ingestion) and cleaning and standardizing it into a consistent format (normalization). Without those steps, teams spend more time pulling and fixing reports than making decisions.
Ingestion and the portal problem
Most CPG brands sell through dozens of retail partners. Each retailer – whether it is Target, Amazon, or a regional grocer – provides data through its own proprietary portal, and each one looks a little different. Some update daily, some weekly, and the level of detail can vary. A manual approach to retail data analytics involves downloading reports from these portals, formatting them, and incorporating them into a master file. This process is slow, error-prone, and usually outdated by the time it reaches an analyst. A scalable strategy requires automated pipelines that connect directly to retailer portals, pulling POS and inventory data on a daily or near real-time schedule.
Normalization and standardization
Once data is ingested, it still needs cleanup. Retailers may format store names, UPCs, pack sizes, and dates differently, and some reports can include duplicates or missing fields. Normalization standardizes those inputs so the same store, product, and time period show up consistently across data sources. The result is clean, reliable tables that are ready for reporting and analysis.
The semantic layer
Even with normalized data, teams can still struggle to make accurate comparisons across retailers. Retailers can label the same product in their own way, organize items into categories differently, and apply different rules to common measures. For example, one retailer may report sales in units while another reports cases, or one may treat returns and discounts differently when calculating net sales.
That’s why a semantic layer (sometimes called a harmonized model) is necessary. It’s the shared set of definitions your internal teams use so reports can calculate and group results the same way across retailer data sources. This makes cross-retailer reporting more reliable – and saves teams from reconciling numbers every time they run an analysis.
A manual approach to retail data analytics involves downloading reports from these portals, formatting them, and incorporating them into a master file. This process is slow, error-prone, and usually outdated by the time it reaches an analyst.
Key problems retail data analytics helps solve
Once point-of-sale (POS) and inventory data is centralized and cleaned, the next step is using it to solve specific operational problems – especially the ones that impact availability, fulfillment, and replenishment.
Availability and faster out-of-stock resolution
On-shelf availability (OSA) is one of the most immediate ways retail analytics drives revenue. A monthly consumer survey found that 9.5% of consumers reported an out-of-stock item in 2024 (on average). When items go out of stock, you lose sales, damage shopper trust, and create extra work across sales and supply chain teams.
The challenge is speed. If your reporting is delayed or updated too infrequently, you often discover out-of-stocks after the moment has passed. More timely data helps teams spot availability issues earlier, pinpoint where they’re happening (which retailer, stores, regions, SKUs), and prioritize the right fix – whether that’s a replenishment adjustment, a store-level inventory correction, or a distribution issue.
The goal isn’t just reporting what happened – it’s catching availability issues early enough to act.
Omnichannel fulfillment accuracy
As retailers see greater Buy Online, Pickup In-Store (BOPIS) orders, inventory accuracy is critical. If a system says an item is in stock, but the shelf is empty when a picker shops for it, the customer order fails.
GS1 US reports that 80% of retailers are not confident in their product data, citing a 50% failure rate for BOPIS picking accuracy in some contexts. For CPG brands and suppliers, that means ensuring inventory data supports both in-store and online demand so digital orders can be fulfilled.
Supply chain and distribution
Data analytics shouldn’t stop at the store. When brands connect store-level sales to distribution center (DC) inventory (weeks of supply), they can time replenishment more accurately and reduce both stockout and excess inventory.
This also helps prevent the “bullwhip effect,” where small fluctuations in consumer demand turn into over-ordering or under-ordering upstream. By sharing unified retail data with distribution and logistics partners, CPG teams can move from reactive shipping to steadier, demand-aligned replenishment.
When brands connect store-level sales to distribution center (DC) inventory (weeks of supply), they can time replenishment more accurately and reduce both stockout and excess inventory.
Improve supplier performance
Putting retail data to work
Dashboards are useful but they’re not the end goal. The goal is getting retail datainto the systems teams rely on everyday, so decisions don’t depend on manual exports, version confusion or outdated files.
Cloud destinations and BI
Modern retail analytics often means sending harmonized data into cloud data warehouses like Snowflake, Google BigQuery, or Databricks. From there, brands can blend retail data with internal data sets, like finance, marketing, or supply chain, for a more complete view.
Platforms like Crisp facilitate this by automating ingestion from 60+ retailers and distributors, normalizing the data, and delivering it to your chosen destination. The benefit: teams don’t need to build and maintain their own scrapers or fragile API connections, and analysts can spend more time using data instead of cleaning it.
Managing restatements
Retail data is not static. Retailers frequently issue “restatements” – corrections to previously reported sales data due to returns, audits, or system errors. That means last week’s numbers can change after the fact.
A solid analytics pipeline needs to handle these changes cleanly. If your system only appends new rows and never updates historical data, your reports will drift from reality. Your architecture should be able to identify changed records and update them quickly so you keep a “single source of truth.”
Modern retail analytics often means sending harmonized data into cloud data warehouses like Snowflake, Google BigQuery, or Databricks. From there, brands can blend retail data with internal data sets, like finance, marketing, or supply chain, for a more complete view.
Common implementation pitfalls
Even well-funded analytics initiatives can fail if they ignore the nuances of the retail environment.
Ignoring data governance
Data quality must be treated as an operating discipline, not a one-time cleanup project. Master data management (MDM) ensures that product attributes, dimensions, and hierarchies are accurate. If the master data is flawed, the analytics will be misleading.
Underestimating privacy risks
As brands collect more granular data, especially regarding loyalty programs and customer behavior, privacy governance becomes paramount. The NIST Privacy Framework provides a solid structure for managing these risks. Treat data governance and privacy as foundational elements, not afterthoughts.
Focusing on the wrong metrics
It is easy to get distracted by ‘vanity metrics’ or market statistics that don’t reflect your true performance. Practitioners should focus on actionable KPIs:
- On-Shelf Availability (OSA): The percentage of time a product is available for purchase.
- Void Rate: The percentage of authorized stores not scanning a product.
- Weeks of Supply (WOS): Current inventory divided by average weekly sales.
- Granular sales trends: Granular sales data down to the SKU- and store-level reveals a wealth of insights to power targeted strategies and even power digital advertising.
Master data management (MDM) ensures that product attributes, dimensions, and hierarchies are accurate. If the master data is flawed, the analytics will be misleading.
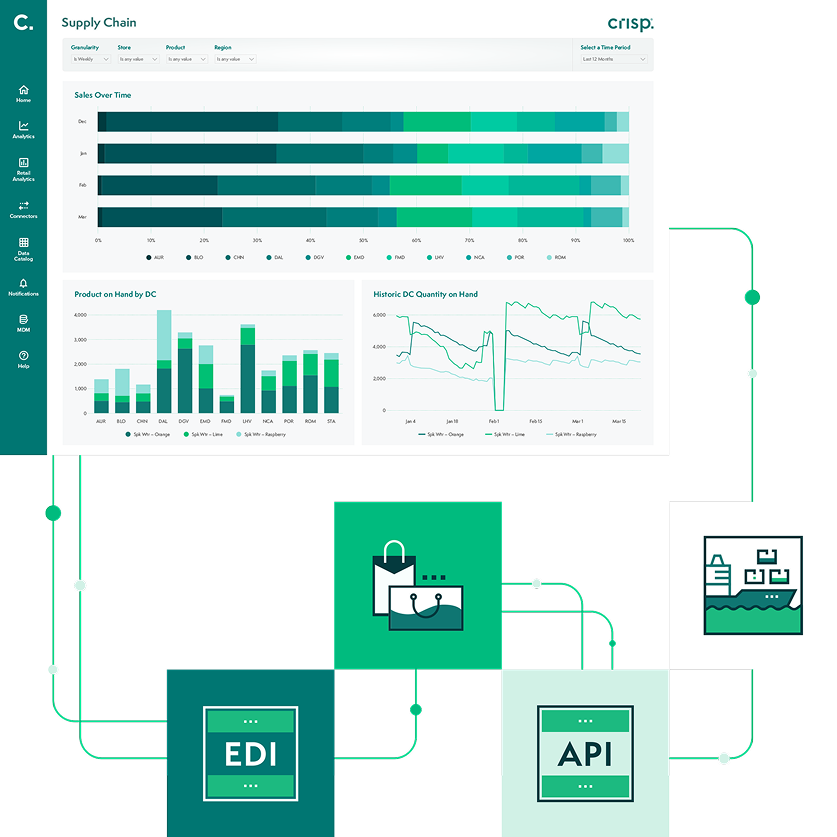
Automated data flow for retail analytics
Moving toward action
Teams usually move past spreadsheets when weekly updates aren’t fast enough anymore. The goal is making decisions quickly with numbers you can trust.
Start by auditing your current data sources and workflows. Note where people are downloading files, reformatting reports, or reconciling numbers by hand. Those steps slow teams down and introduce errors. Also look for blind spots where missing or late data leads to stockouts or excess inventory. Even small improvements here can save hours each week.
Next, align on a shared data model so sales, inventory, and returns match across systems. Whether you build this internally or use a partner to manage the data integrations, the goal is the same: a clean, consistent stream of facts that allows your team to make decisions with confidence.
Don’t wait for a perfect dataset. Start with the areas that move money first – inventory, sales velocity, and returns – and expand from there as your foundation gets stronger.
Get insights from your retail data
Crisp connects, normalizes, and analyzes disparate retail data sources, providing CPG brands with up-to-date, actionable insights to grow their business.