


A masterclass in velocity
There is one retail metric that all brands should pay closer attention to: velocity. While you may already be familiar with velocity, there’s much more to uncover here than you’ll see at first glance. If your brand focuses on meaningful velocity analysis, the insights you’ll glean can lead to profitable and sustainable growth.
Why velocity matters
Velocity is arguably the most important metric you need as a retail supplier. Simply put, it’s the speed at which your product sells in a given store, typically measured in units per store per week. Velocity is one of the main levers of growth, and it’s a big part of fundamental retail math: Sales = Velocity x Distribution. In other words, the amount you sell is a combination of the number of stores you’re in, and how fast your product is selling in those stores. Knowing the relationships between these numbers defines your sales strategy.
Sales = Velocity x Distribution
Velocity is also a fundamental metric for retailers, who must allocate precious shelf space by considering how products will move off the shelf. In this case, velocity is used as a lens to curate the right mix of products for a given category. For example, some more innovative, take-a-chance products have a slower velocity, so retailers often carefully balance these products with some reliable heavy hitters. Therefore, offering your velocity is a main input for buyers to determine if you fit in the assortment. Some will even have a minimum velocity you’ll need to meet to qualify for the store.
Most brands who have talked with retailers of a certain size are already familiar with velocity. But many still aren’t analyzing velocity the way that they should. Why is that? For starters, brands tend to focus too much on distribution: more stores equals more sales, right? Savvier teams know otherwise. Think of the phrase, “inch wide, mile deep” — which is to say, if you’re going to be in a store, you better really be successful there. Quality of distribution is important, and the measure of that quality is velocity. This is the virtuous cycle of retail: if you launch your brand in the right stores, then your velocity will be high. You can take that strong velocity number to the next buyer, and they will be impressed enough to take you on. If those are the right stores, your velocity keeps climbing… and that is how you win. The reverse scenario can be true too: if your velocity is poor and your product is in stores that aren’t a good fit, you will appear less attractive to future buyers. While as an emerging brand you might be desperate for distribution, trust us: it’s not worth it, even as a small brand, to just take any store.
Another reason brands don’t fully strategize around velocity is that it takes a fair amount of data savvy, especially if you’re looking to derive more meaningful insights. That’s why Crisp has Velocity Dashboards to make this analysis more accessible (more on that later).
Building a velocity-driven growth plan
So, we’re ready to dive deeper into velocity. The first step is to identify what’s driving your overall velocity up or down. After all, velocity is not just one number: it differs by product, region, chain, and other variables that affect your average. If you’re pitching each retailer just one velocity number, that’s your first mistake. To create a compelling case to buyers, you’ll need to understand all of the factors that drive velocity upward and use them to your advantage. Play to your strengths by identifying your velocity hotspots: the mix of products and locations where you fly off the shelves. From here, you can identify similar looking opportunities and gather evidence to support the idea that you’ll be successful. For example, when talking with Sprouts, you can share that you’re very strong in the Midwest, and you have velocity metrics from chains with similar demographics that prove your product moves quickly in these stores. Not only will this work, but as a buyer, they’ll think, “wow, this brand knows their stuff!”
Play to your strengths by identifying your velocity hotspots: the mix of products and locations where you fly off the shelves.
Building a case around velocity hotspots doesn’t just get you into stores — it’s also a helpful way to expand your product line within existing stores. Maybe you’re doing well in a particular store format in South Dakota. Say you offer two different versions of your product, and your South Dakota stores carry one of them with velocity numbers through the roof. The second product is a similar flavor profile and size but is sugar free. You know that these two products won’t compete with each other in the category, so you can make a solid case here to consider adding it to the assortment. That’s a big win for both you and the buyer.
How to find your velocity hotspots
It hasn’t always been easy to slice and dice velocity this way, and typically required having someone on staff with advanced Excel skills. But Crisp’s Velocity Dashboard changes that. Crisp’s Business Health Dashboards (covering Sales, Distribution, and Velocity) were built to put important insights at the fingertips of sales teams with charts and visualizations that guide you through three main sections: the What (what’s happening?), the Why (what is causing it?), and the How (how can I take action based on these trends?). Interactive filters make it easy to get granular: simply click on a location, product, or banner to drill down and filter, landing on sweet spots and voids in the market that you can take advantage of.
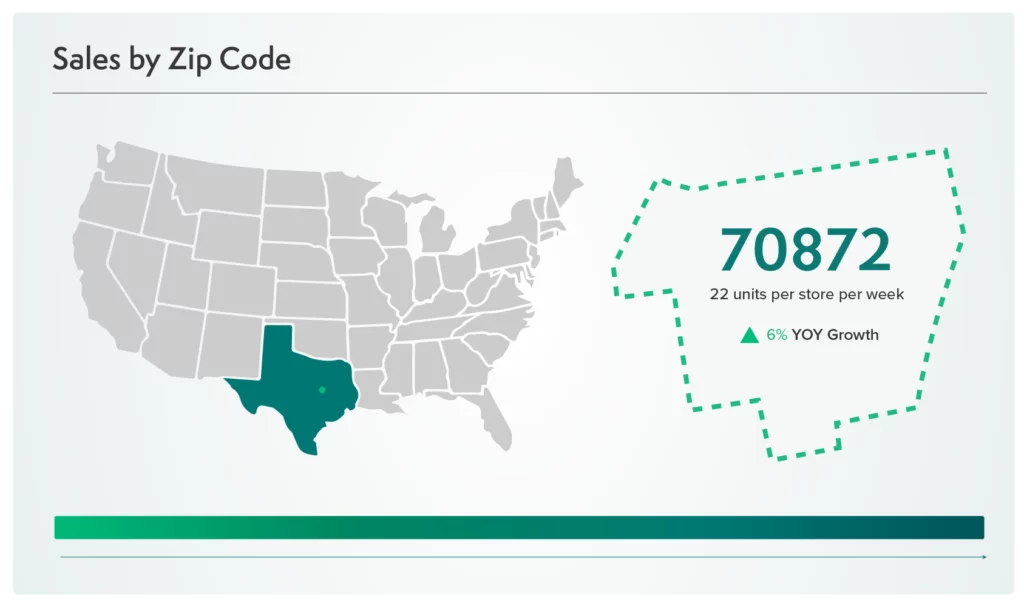
Crisp’s geographical heat maps and location data have been particularly helpful to brands looking to understand their velocity hotspots. With this information, you can show a buyer that a particular product is an absolute success in the Northwest region, for instance, and back this up with charts downloaded form the dashboard. You can even show your buyer specific store locations or zip codes where your product would sell best. This way, instead of just saying, “We’d like to expand in the Northwest,” you can say, “Here are the exact zip codes where my product does well in the Northwest, and here are the average weekly sales in those zip codes.” If you’re a smaller brand, this will truly blow a buyer’s mind — it’s unlikely they have ever received such tangible recommendations from a brand of your size. At Crisp, this is our goal: helping brands discover and showcase insights that will take them to the next level.
Get insights from your retail data
Crisp connects, normalizes, and analyzes disparate retail data sources, providing CPG brands with up-to-date, actionable insights to grow their business.