


Using data for demand planning
Integral to sales and operational planning within your organization is a solid forecast of upcoming demand. Demand planning takes into account past sales performance and existing trends that might have an impact on sales, such as growth in distribution or increased velocity, with an expectation for how much your products will sell in the coming months and years. Demand planning also takes into account marketing programs and events like holidays and promotions that will impact sales velocities. The end result will inform everything from operational planning to raw material sourcing to production runs.
Here, we’ll show you an example of how you can use your past sales data to project demand, using a hypothetical scenario projecting sales in July for a cookie product.
Step 1: Pull up relevant data
Start by pulling up your current and historical sales data for key retailers or distributors. In Crisp, you can select your sales dashboard for each or pull up unified retailer and distributor sales dashboards.
Once you’ve pulled up data for the relevant retail partners, you will want to filter for the following:
- The specific product you’re planning for (in our case, cookies).
- The time frame you want to analyze. For this example, we’ll look at data from the last two years.
Step 2: Establish your baseline
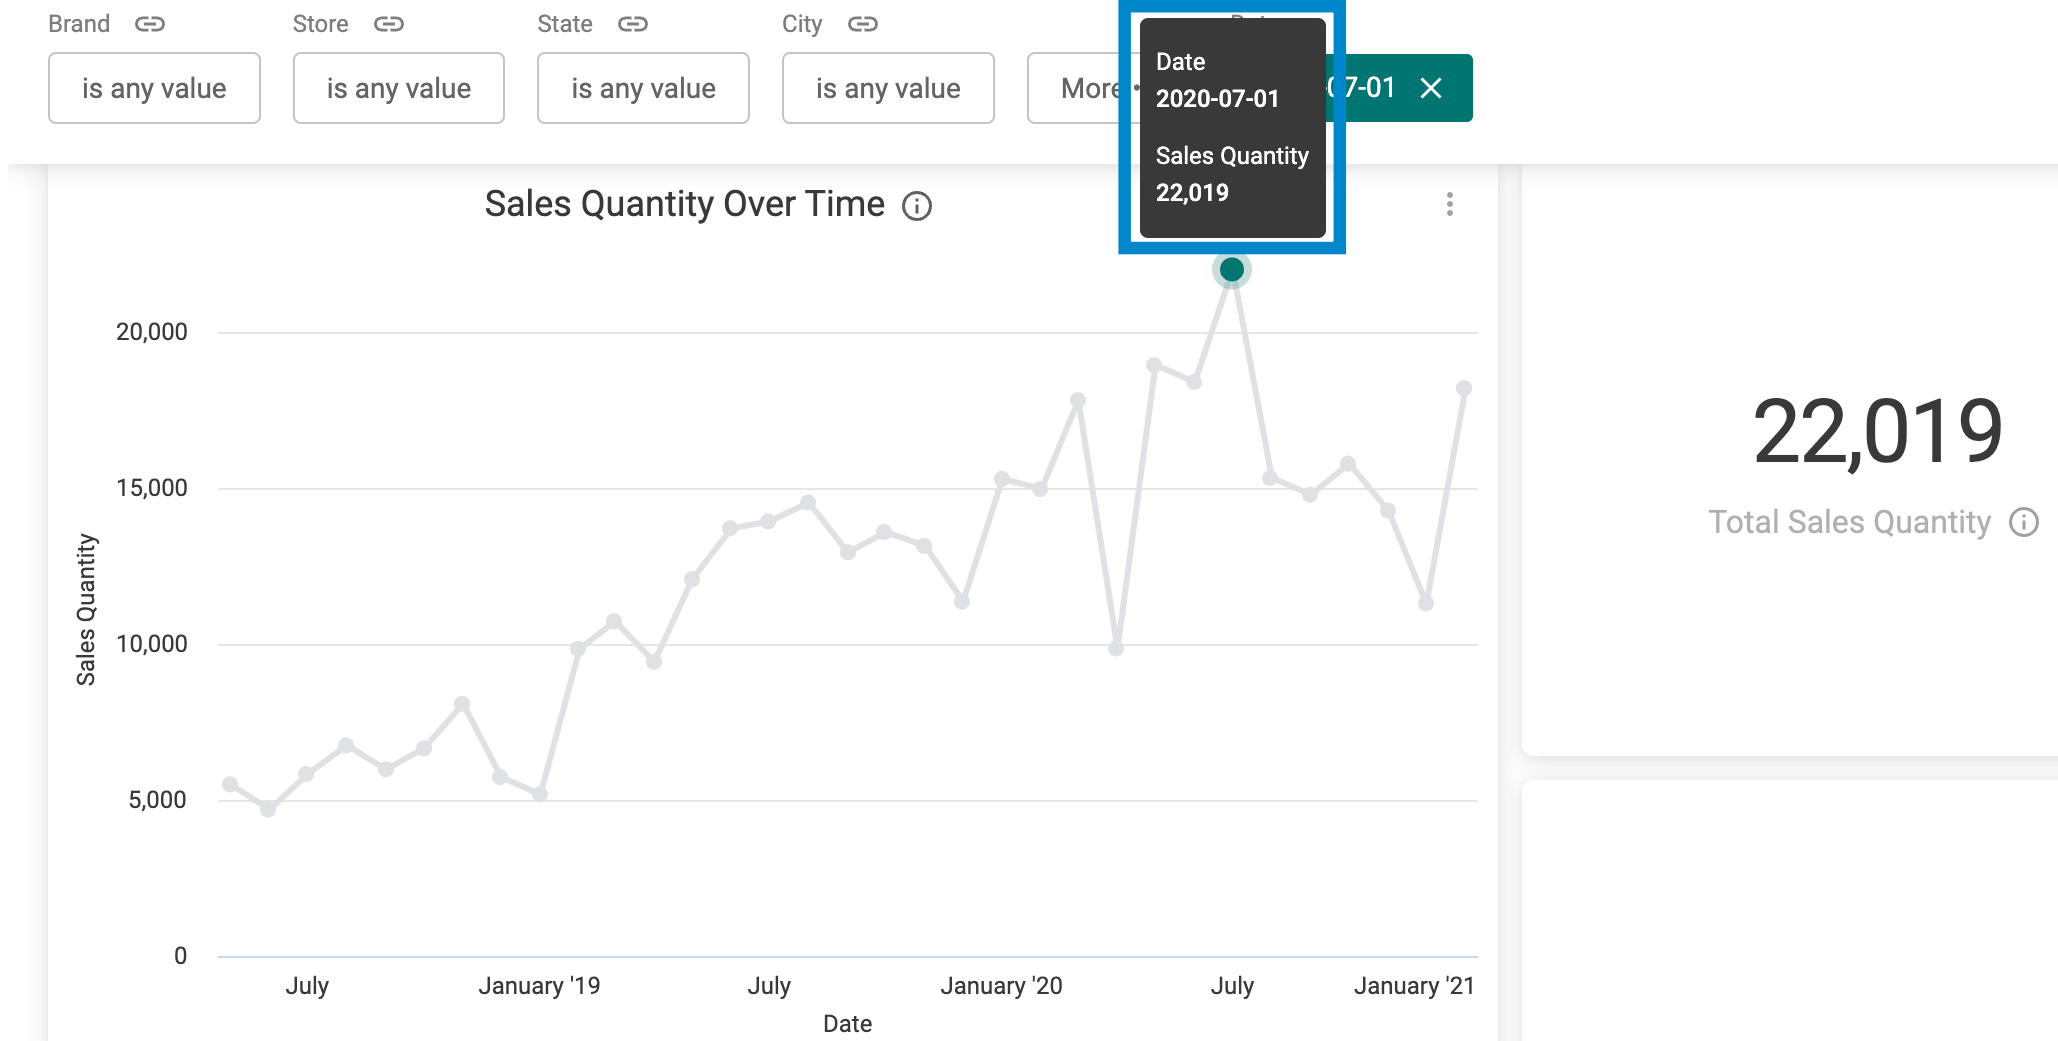
Now, look at sales from the previous year to get the baseline number for your sales projections. Crisp has a Sales Quantity Over Time visualization that makes this easy to spot. Let’s say that for this example, we know you sold 22,019 units last July.
Step 3: Calculate your YOY growth
Now, you’ll want to calculate how much your sales have increased this year compared to last year. To do this, you’ll need two data points:
- Your total sales for the past month — let’s say that was 18,210 units
- Your total sales from that same month a year ago — let’s say that was 15,306 units
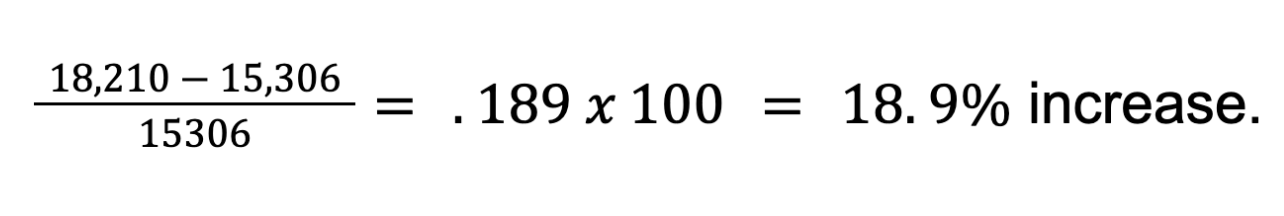
Then, you can calculate the increase using the following formula:

In this case, the math works out as follows, and you can see want to plan for a 19% increase:
STEP 4: Calculate your projected demand
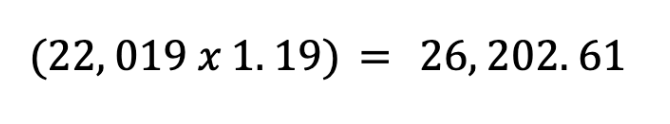
Now, we’re going to combine last year’s July sales (Step 2) with your year-over-year growth rate (Step 3) to project demand for next July. You can use the following formula:

In this case, the math works out like this:
Note: This example only projects regular sales inventory. If you don’t already have safety stock, you may want to increase your projection for a month or two to build up safety stock.
Now, you know you need to produce around 26, 203 units to meet projected demand for July. You can use this information to determine the quantity of raw materials to purchase and create a production schedule to deliver the right amount of product.
To learn more about how you use Crisp for demand planning, check out the Crisp Knowledge Base.
Get insights from your retail data
Crisp connects, normalizes, and analyzes disparate retail data sources, providing CPG brands with up-to-date, actionable insights to grow their business.