


Data 101 for sales leaders
Good news for sales leaders: New tools are emerging that put the power to analyze and share data into your hands. Now you can pull reports from multiple sources inside and outside of your company, link them together, and get insights quickly. These tools also make it easy to slice and dice data into a compelling story for your buyers.
Ok, so now you can handle your own data analysis and reporting — but as a sales leader, what data should you be looking at? What do you do with it? Who should you share it with (and why does it matter)?
We’re here to answer those questions. Here’s how to delve into data to:
- Guide your sales team
- Help marketing and production teams succeed
- Become a better partner within your supply chain
- Build data-driven stories for retail buyers
You’ll learn just what you need to know to make this all happen without becoming overwhelmed. Let’s get started.
Start with “what” and “how”
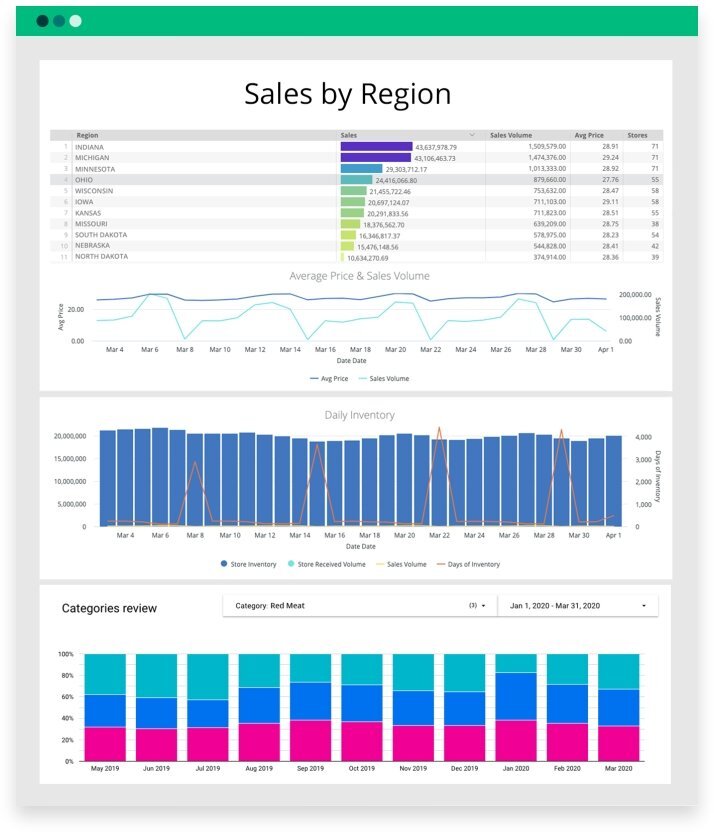
You probably know your sales numbers from POS data, which is a good start. But combining sales with other important data is key to a profitable growth strategy. To deepen your insights, look into how those numbers change over time, and how they correlate to your distribution plan.
For example, you might already know that you sell 10 units per week to Whole Foods. But when you take a look at your sales over time, you may find that you started out selling six units per week to Whole Foods and that number increased to the current 10 units over the last year. You’ll want to review this against changes in coverage over that same year. How has it impacted your velocity? You can also overlay these numbers onto marketing investment to see the impact of promotions or geo-targeted ads. As a salesperson, you’ll want to demonstrate to distributors and retailers that you understand velocity trends, are working to improve them, and are smart about where you’re advocating for greater coverage. This starts with pulling together the right data inputs.
Mix and match to find the “why”
Once you understand how your sales numbers are trending, use your data to figure out the “why.” In other words, why are your numbers trending up or down? What can be done about it?
Add data from other partners & teams
Combining your sales numbers with data from other teams and your supply chain partners can surface additional insights and get to the true cause of any trends.
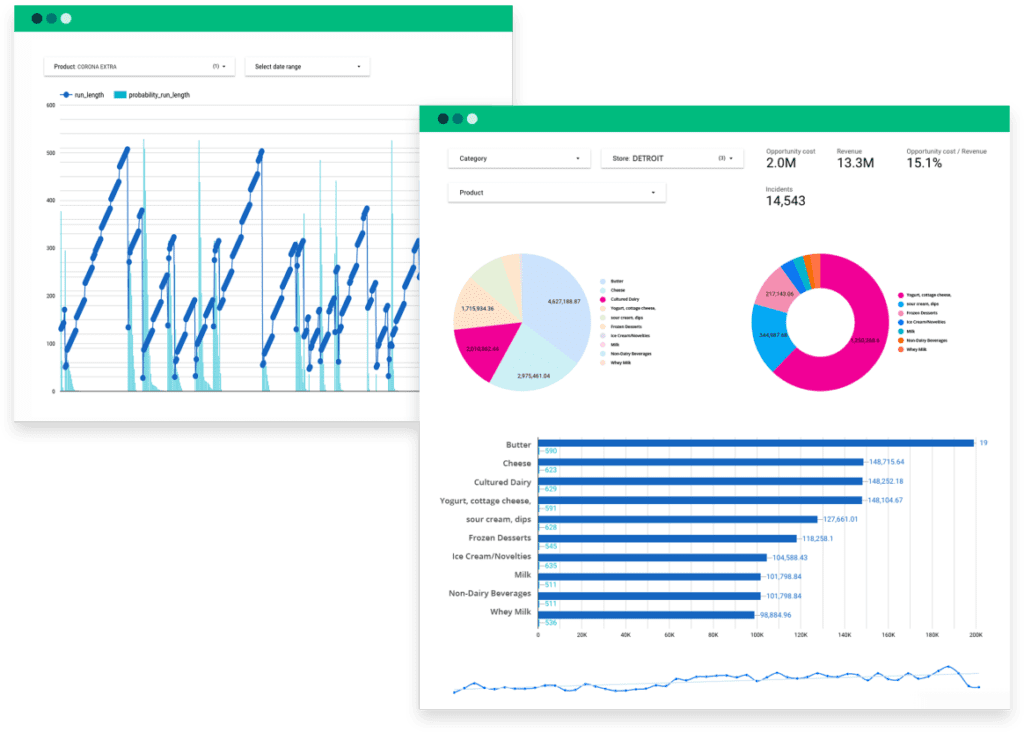
For example, say after a promotion you look at your sales performance numbers — which measure how you’re currently doing versus your expectations — and you see a 25% increase in sales when you expected to see a 50% increase. If you look only at your sales data, it’s all too easy to think that poor execution of that sales promotion is to blame.
But if you take data from other departments and partners into consideration, you might notice instead that:
- Your product went out of stock due to a mistake in demand planning, transportation, or distribution. (You need: data around inventory levels, transport dates, and order fulfillment.)
- Your biggest competitor ran a promotion at the same time. (You need: competitor insights, retailer data on which promotions work best in which stores.)
- The offer priced your product outside of the sweet spot; it was too high for bargain shoppers and too low for people who look for high-end products. (You need: market demographics, retailer data on how pricing affects sales; see below for more on these.)
These revelations will enable you to focus on the real issue — so you don’t waste time fixing things that don’t need to be fixed. And if a product underperformed, you can plan a response for your next buyer meeting to keep that product on the shelves. With data, you can show the mitigating circumstances around the poor performance and prove that you’ve taken steps to ensure this won’t happen again.
Add industry & market data
Looking at industry and market data is another way to gain a deeper understanding of the “why,” hone your sales strategies, and become a more valuable partner to retail buyers. Some of the data you might consider includes:
- Market demographics. These are the characteristics of your market and of the consumers in a given location. If you have this information you can, for example, tell a retail buyer that because neighborhood X has a high proportion of residents aged 18 to 30, their store there might be a good testing ground for your new energy drink.
- Consumption patterns. Low-fat diets are trending up again? This could be the “why” behind the declining sales of your Keto line. Let retailers know this, and suggest swapping in some of your new lower-fat formulations.
- Price elasticity of demand. This metric shows how price changes affect demand. Say the data shows that raising the price of a particular product (counterintuitively) increases demand. Now you know why your sales numbers are trending up on that item. This is valuable information for retail buyers as well.
Looking for the “why” behind your sales numbers does more than help you course-correct when things go wrong and double down on successful strategies — it can also make you a better partner to retailers by helping busy buyers make smarter decisions.
Use data to guide your sales team…
Having all this information is pointless if you don’t actually put it into play. Your sales team doesn’t need a spreadsheet full of numbers to click through; they need to see how those numbers translate into real-world action so they can spend their time actually making sales.
Create clear, simple reports for your sales teams with recommendations for product offers, pricing strategies, and negotiation tactics that have been shown to work. (Your data platform may let you quickly create reports from the dashboard.) You can also develop a list of data-based talking points your team should have memorized when meeting with retail buyers.
…But not JUST your sales team
When you’re a new food brand, you might combine your data with gut instincts to make and act on decisions quickly: “We’re doing promotion X next month. When we did a similar promotion, orders increased by 10%, so we should step up our output by 10%.”
But as a company grows, other people need this information — and they need it presented in an organized way that lets them know at a glance what steps to take next.
For example, your marketing team needs to see the results of their efforts in sales numbers and your production team needs the data to predict demand. “Production wants some guidance from the sales team…otherwise they’re just shooting in the dark based on how much they produced last week,” says David Koretz, a food industry entrepreneur and founder with experience in fresh, frozen, and shelf-stable products. “They don’t necessarily have the promotion calendar. They don’t necessarily know the projected growth calculated by the sales team.”
Get insights from your retail data
Crisp connects, normalizes, and analyzes disparate retail data sources, providing CPG brands with up-to-date, actionable insights to grow their business.