


Evaluating the success of a promotion
Measuring how a marketing campaign or sales promotion impacted your product sales is an important way to identify successful promotion strategies and improve execution in the future. Did sales increase enough to offset the margin hit from a price reduction? Did your promotion attract new, longer-term customers, or just cannibalize existing revenue? These are the hard questions you’ll want to ask — and answer — through data.
The method you use for tracking your promotion’s success depends on the promotion timing and context. First, we’ll outline three ways you can evaluate promotions depending on your product’s promotion history, seasonality, and distribution growth. Then, we’ll walk through how to use each method.
Three ways to evaluate your promotions
There’s more than one way to evaluate a promotion. The following three methods allow you to account for the promotion context:
- Method 1: Direct previous period comparison — This method is best when the promotion did not take place during a seasonal sales trend (such as selling pie crust during Thanksgiving in the U.S.)
- Method 2: Year-over-year comparison — This method is best if you ran the same promotion the previous year, or you are in the middle of a seasonal trend.
- Method 3: Year-over-year lift comparison — This method is best when you want to compare a promotion to the same one you ran the previous year, but your distribution has grown and you want to account for that.
Method 1: Direct previous period comparison
With this method, you’re calculating the difference in sales from the recent promotion to the sales from a similar time frame just prior to the promotion. We recommend this approach when the promotion did not take place during a seasonal sales trend (for example, the onset of Thanksgiving for a pie crust product) and you simply want to compare the difference in sales between the promotion period and a normal sales period. This difference in sales is called sales lift and is calculated using the following two calculations:
Sales lift
Increased sales quantity = sales (promotion period) – sales (comparison period)
Sales lift percentage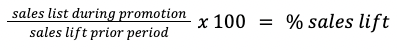
Method 2: Year-over-year comparison
Another option is to take the sales from the promotion time period and compare it to the sales from the same time period the year before. We recommend using this method if you ran the same promotion the previous year, or you are in the middle of a seasonal trend.
Let’s say you want to compare a hot dog sale you ran this past month to the same promotion you ran the previous year.
The main thing you want to do here is check sales for your current promotion window, and then compare them against the same period the year prior. Crisp’s Year over Year Sales Dashboard makes this easy by automatically comparing any time period with the year prior.
The tiles below display your sales quantity and dollars for this year and display the percent change from last year. In this case, you can see your sales went up around 56% from the promotion period the previous year — wow! 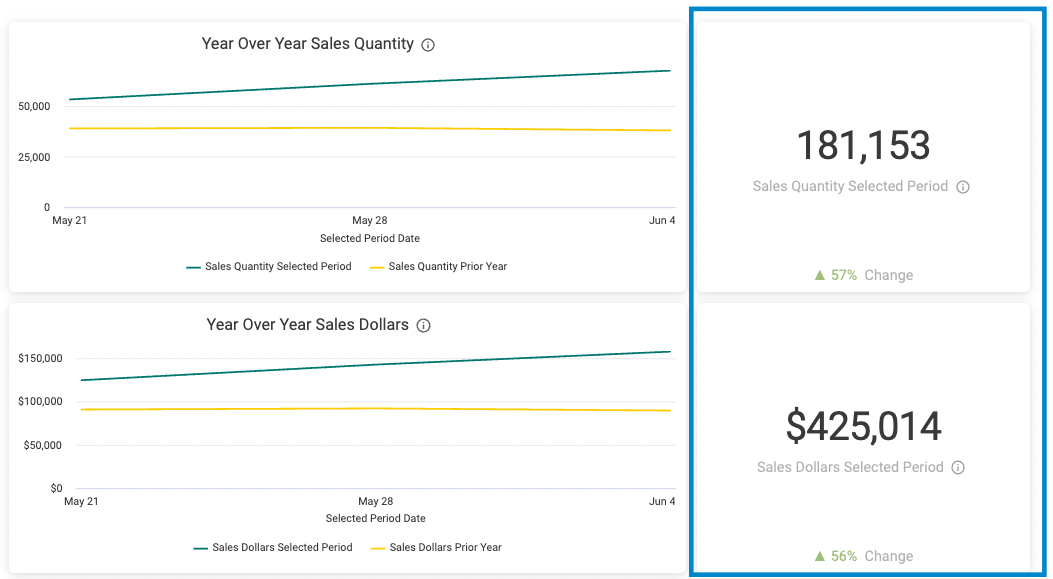
Method 3: Year-over-year lift comparison
Let’s say you want to compare a promotion you ran this past month to the same promotion you ran the previous year, but your distribution has grown and you want to account for that. If we were to simply compare last year’s sales to this year’s sales (as in the previous method) your numbers would be off for because some of that difference in sales might be due to increased distribution. Of course your sales will be greater this year if you are selling in more stores, but that doesn’t necessarily mean your promotion performed better than last year.
So, just like the first method, you will need to find the difference in sales lift from the promotion period and the comparison period just prior. But you will also need to find the difference in sales lift for the same time frames last year. Then, you can compare the sales lift from last year to this year to see how well your promotion truly performed.
To calculate the difference in lift, we will need sales lift for both this year and last year. You can calculate that with this formula:
Sales lift

Once you’ve calculated lift for both this year and last year, you can calculate the difference in lift from last year to this year with this formula:
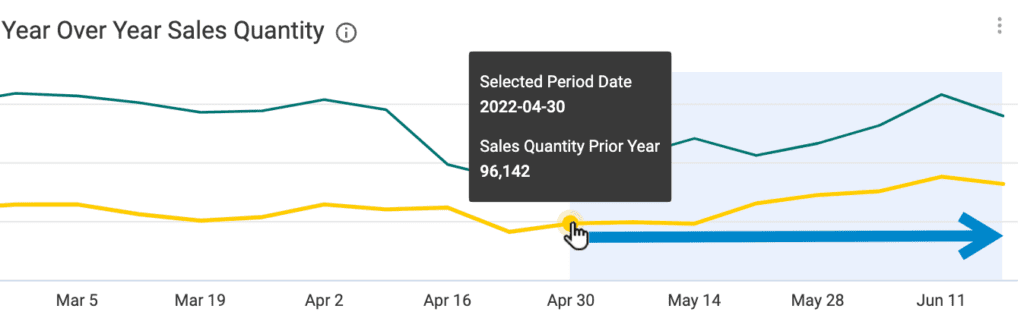
We need to pull data from six different time frames to perform these calculations, but Crisp makes that easy. On Crisp’s dashboards, it’s a snap to filter for specific dates: you can just click a beginning date in the line chart (e.g., 4/30), then drag your cursor to the end date of the period you want to evaluate.
Once you pull the data you need, you can plug it into the sales lift formulas and quickly see your performance compared to last year when normalized for the growth in distribution.
By understanding the best way to calculate lift depending on the context of your promotion, you’ll be able to accurately evaluate your promotions’ success and design more successful promotions in the future.
To see an in-depth tutorial about evaluating promotions with Crisp, see Crisp’s Knowledge Base > Evaluating Promotion Success.
Helpful tools for promotion planning
You can also use a trade promotion management platform to help you design and plan more effective promotions. Crisp has built an integration with Promomash, the leading trade spend platform for emerging brands, to help brands leverage their actual sales and inventory data to plan, execute, and evaluate more successful promotions directly within Promomash. To learn more, visit go.promomash.com/crisp.
Get insights from your retail data
Crisp connects, normalizes, and analyzes disparate retail data sources, providing CPG brands with up-to-date, actionable insights to grow their business.