


How to run your Monday mornings
Monday mornings can be stressful for anyone working in CPG sales. To figure out your priorities for the week ahead, you need to first understand how last week went — and that requires spending a significant chunk of your day digging through data. You likely have to pull multiple reports from various retailer and distributor portals, wait for those reports to run, then clean, organize, and filter all the data before you can start running any sort of analytics (let alone sell anything).
Crisp was designed to change that. Crisp automatically pulls, cleans, and even visualizes retail data so that when you open your computer in the morning, everything you need to know to drive sales is right at your fingertips. Here, we’ll walk through how sales teams can leverage Crisp dashboards to start the week off right.
Get the high-level distribution story
Let’s imagine a typical sales scenario, starting with sitting down at your desk on a Monday morning. The first thing you might want to know is “were sales up or down last week?” Answering that question, and quickly understanding the why behind the trend, will help you decide what actions to take this week to capitalize on positive trends or reverse negative trends.
To get the high-level story, you can head straight to Crisp’s Unified Distributor Dashboard. On this dashboard, you’ll be able to see combined shipments across all distribution partners (which is often the bulk of business for a growing brand).
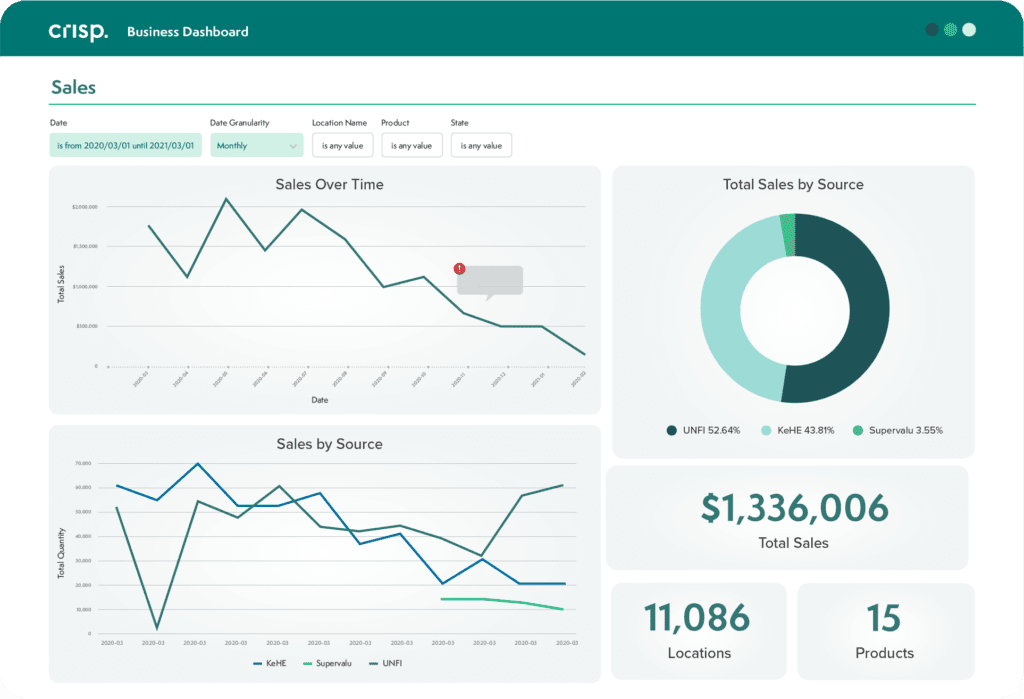
Looking at graphs that show sales over time, you might see in this scenario that shipments for last month were down. Addressing this will likely be your new priority for the week. The first step is to see if this change is related to a particular account or a wider trend. Crisp’s dashboard breaks down sales by distributor, so you might see, for example, that the largest decrease came from one particular partner. Now, it’s time to head over to that distributor’s dashboard in Crisp to figure out what’s going on.
Dig into the details with year-over-year sales
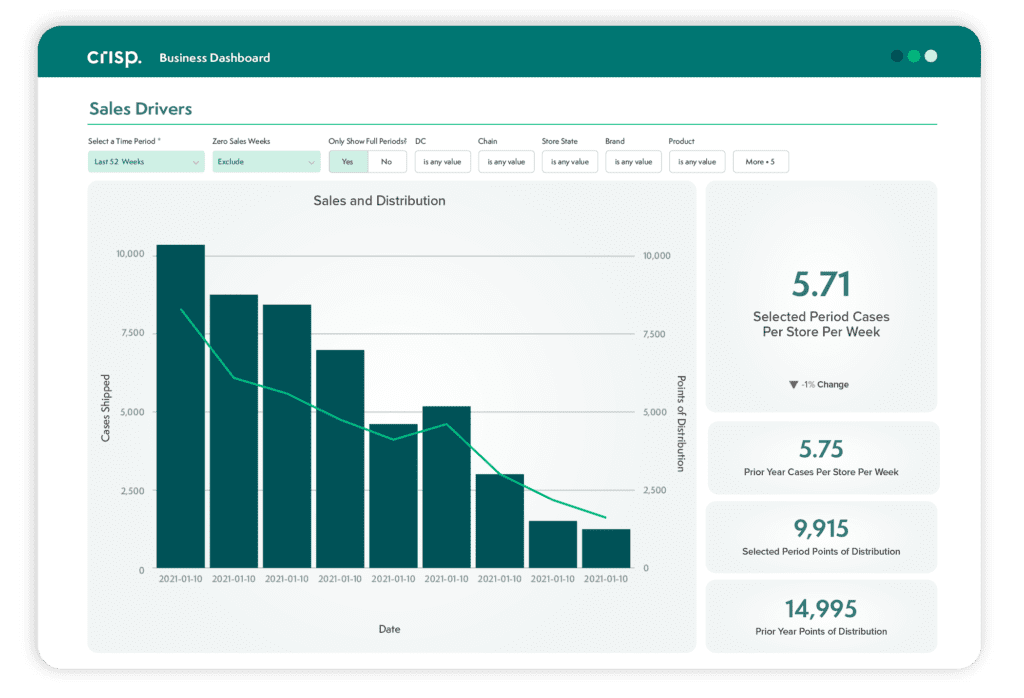
Now that you know where your sales decline is happening, you can leverage Crisp’s YOY Sales dashboards to understand what’s causing that decline.
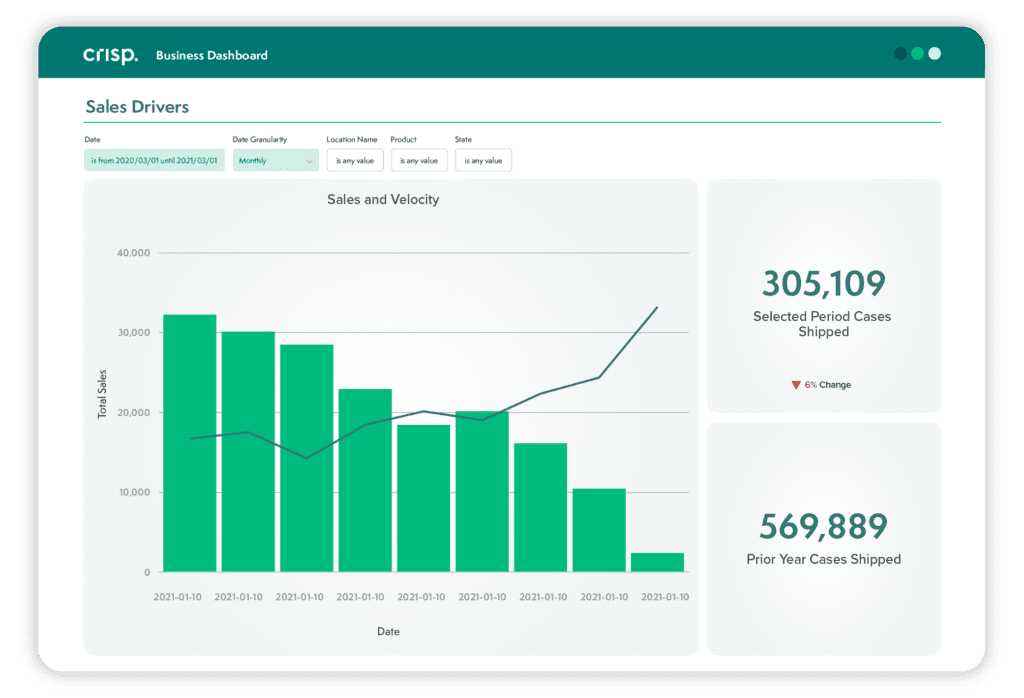
The YOY sales dashboards show an immediate view of velocity, sales, and distribution data over time. This helps you determine the root cause of those declining sales — whether that’s lost points of distribution, declining sales velocity, or something else. Looking at the velocity graphs, you might see that velocity for this particular time period is down compared to prior weeks, but up it’s year-over-year — helping you attribute this trend to seasonality of your product rather than a sales issue. Next, you’ll want to look at the YOY Distribution dashboard, where you might see that distribution is down week over week and year over year. This is an area you’ll want to dig into further, looking at possible trends by product, geography, or retailer to find an explanation for the declining distribution. Looking at sales by product, you may find that distribution losses are across all items, so it’s unlikely a particular SKU is the culprit. You can also check the sales heat map, which may show similar changes across the country. You can now also rule out regionality as playing a big role here.
Looking at sales by chain, however, perhaps you’ll see a large decrease from one retailer, even though sales data showed that velocity is actually up overall. So you can now filter for that retailer’s stores, and head to the Details section of your dashboard to get more information.
The Details section provides information on sales by product and by store. Use this list to target stores that have a high number of weekly cases shipped, and a negative year-over-year change: this is where your efforts can make the biggest impact. With a click, you can export this filtered list and send it to your field team to follow up with buyers and get your product back on the shelf. Since these stores performed well before, regaining this distribution should have a significant impact on overall sales for the brand.
A better way to Monday
Before Crisp, pulling sales, velocity, and distribution reports across three different distributors would have taken all morning, let alone cleaning and visualizing the data to get meaningful direction for the week ahead. This gets in the way of time that should be spent taking action to drive the business forward. But with Crisp, sales teams are able to come in and immediately start analyzing sales trends to focus on their customers and make a greater impact on the business.
Get insights from your retail data
Crisp connects, normalizes, and analyzes disparate retail data sources, providing CPG brands with up-to-date, actionable insights to grow their business.