


Supercharge CPG sales with AI-powered ...
May 29, 2025
By Jordon White
Crisp Product Manager Jordon White shares a roundup of this month’s updates to the Crisp data platform.
At Crisp, we believe that data is meant to drive action. When you have insights to understand your product’s performance across stores and retailers, you can identify strategies to accelerate growth and then work with sales teams, brokers, and buyers to gain market share and attract new customers to your category. That’s what this month’s updates are all about, with a new tool to track year-over-year trends, understand category sales, and share customized reports with colleagues and retail partners. Read on for more about Crisp’s newest features.
Crisp customers use Saved Reports to bookmark frequently-used reports filtered by key products, regions, or banners. But once you’ve found a relevant insight in that particular report, you may want to share it with others. With Crisp’s newest update, customers can share a specific filtered report view with anyone — including colleagues on their Crisp account and even external parties. External report recipients will get an email inviting them to view the report, along with a note you can add for context. Saved Report sharing makes it easier than ever to take action on insights, from sales performance to inventory status to voids.
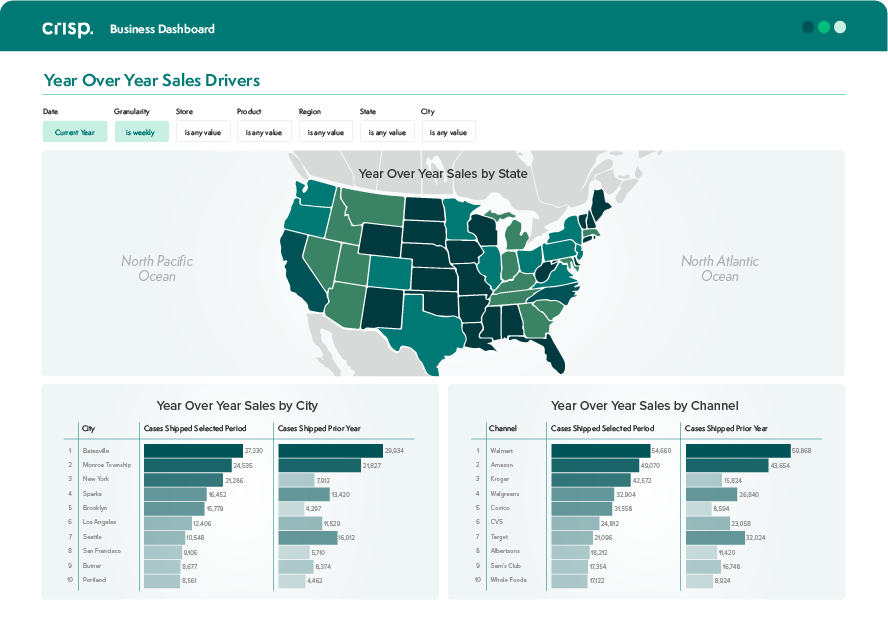
Year-Over-Year Sales Dashboards help brands understand business performance and market trends by comparing current sales patterns to similar periods in previous years. With new dashboards for UNFI and Whole Foods, you can compare YOY data for time periods ranging from two weeks to a year. Once you’ve found a relevant trend, you can easily click to filter down to a specific channel, retailer, distributor, or region to identify drivers of the YOY change. From there, you can take specific action using store and product level performance data, and export store lists to follow up on relevant insights.
The most successful suppliers in a retailer’s eyes are the ones that not only demonstrate strong sales, but contribute to growing the overall category they’re in. Wegmans offers category sales data to help vendors track and strategize category performance, and Crisp’s new Wegmans Category Sales Dashboard makes this analysis easier than ever. You’ll be able to:
Ready see how Crisp’s new tools and features can help your business? Contact us today for a demo.
To keep up with our product updates and data best practices, subscribe to the Crisp blog.