


Supercharge CPG sales with AI-powered ...
May 29, 2025
The team at Crisp has been working to quantify a phenomenon central to our company’s mission: food waste.
One third of all food is wasted before it even reaches the consumer. This is often a result of slow-moving, inaccurate data in the supply chain. Crisp works to address this issue by enhancing data sharing and visibility between food suppliers, distributors, and retailers. Recently, our analytics team has been working on a tracking system that uses retailer data to help food brands identify waste as their product is distributed and sold, and take steps to prevent it. In this blog post, we’ll give you a look into our team’s process to deploy waste tracking, how we add new analyses into our product, and next steps to further Crisp’s mission of reducing waste in the supply chain.
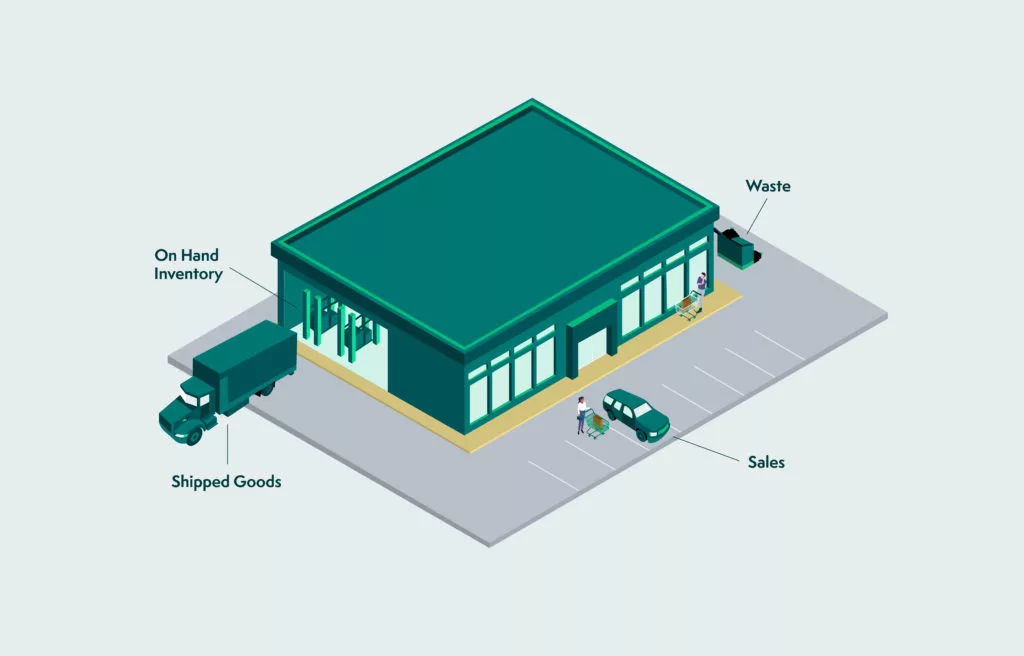
To start, our team hypothesized that waste could be quantified by comparing beginning on-hand inventory, sales, shipments, and ending on-hand inventory at a given retail location. After identifying a retailer that provided information on all of the necessary parameters, we got to work computing the metric.
An important part of this effort was figuring out how to best align the various data sets so we could compare apples to apples. In our case, all three datasets were provided at a store and product-specific level, which was a helpful start. Inventory and sales data were provided at a daily frequency, while shipments were provided on a weekly basis. This implied that the lowest possible granularity at which waste could be computed on this data set was weekly. With the granularity established, we proceeded to take a closer look at each of our data sources.
Inventory data is typically a snapshot of how much product is available in a store (either on the shelf or in storage) and is refreshed at periodic intervals. The temporal field in our inventory data set was stored as a date, rather than a timestamp, making it impossible to know exactly when each update occurred. For our test retailer, we were able to confirm that inventory values are recorded at the end of every day, which helped us map sales, inventory, and shipments to the same time period.
|
Store |
Product |
Date |
Quantity |
|
123 |
A |
2021-01-01 |
20 |
|
123 |
A |
2021-01-02 |
15 |
|
123 |
A |
2021-01-03 |
25 |
An example of inventory data
Shipments data provides information on goods that have been shipped from a distribution center to a store. Our data set summarized the quantity shipped weekly by store and product. Therefore, comparing product shipments with inventory data would require the retrieval of on-hand quantities at the start and end of each week.
The absence of information on when each shipment was received by the store posed another problem: in some cases, shipments might arrive one week but do not show up in a store’s inventory data until the following week. This issue was addressed in post-processing of the waste metric (more on that later).
Sales data is available daily at the store and product level.
Once the inventory, sales, and shipments data was successfully aligned, we computed the waste metric using the following formula:
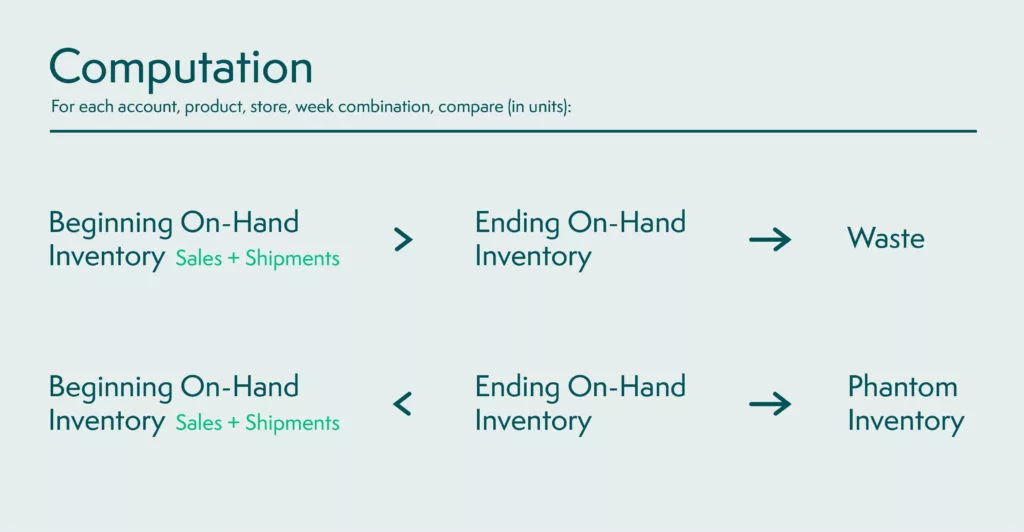
Phantom inventory refers to a situation in which there is more product than expected at the end of a given time period. This can happen if products were returned, or for some reason not recorded when received in the first place.
Remember the issue we encountered with shipments and recorded inventory being slightly misaligned? As it turns out, we can identify when this occurs after performing the waste computation.
Let’s assume that for a given store and product, there is a shipment of s units in week w that does not appear in inventory data until week w+1. Then,
We can therefore add a post-processing step that checks for the presence of these two conditions and adjusts the waste and phantom inventory accordingly.
|
Week Starting |
Starting inventory |
Sales |
Shipments |
Ending inventory |
Waste |
Phantom Inventory |
Adjusted Waste |
Adjusted Phantom Inventory |
|
2021-01-02 |
100 |
10 |
10 |
90 |
10 |
0 |
10 |
0 |
|
2021-01-09 |
90 |
20 |
15 |
65 |
20 |
0 |
5 |
0 |
|
2021-01-16 |
65 |
10 |
20 |
100 |
0 |
25 |
0 |
10 |
|
2021-01-23 |
100 |
5 |
0 |
100 |
0 |
0 |
0 |
0 |
An example in which 15 units of product A were shipped the week of 2021-01-09, but did not appear in the inventory data until the following week.
Normalization is important to the “so what?” application of the waste metric. This becomes apparent when you compare values for one product against another. Comparisons based on total waste can be misleading: an older product will have a higher waste count than a newer product, as will products that appear in more stores. To enable helpful comparisons of waste between products, we computed the average waste across all store and week combinations.
|
Product |
Total Waste |
Store Count |
Week Count |
Average Waste Per |
|
A |
1,000,000 |
3,500 |
45 |
6 |
|
B |
700,000 |
3,500 |
15 |
16 |
|
C |
300,000 |
3,500 |
30 |
2 |
Product B has only been present ⅓ as long as product A, but has 0.7 times as much waste per store-week, so it has a higher waste average
Up until this point, we’ve referred to waste as a value measured in units; however, it is also possible to quantify waste in dollars. We used the value in dollars of goods provided in both the sales and shipments data to calculate the dollar value of goods in inventory and ultimately the value of wasted product.
Since results are limited to data from a test set of vendors working with a single retailer, it is too early to establish broad conclusions about food waste from this metric. However, we have seen early observations about the relative ranking of product departments by average waste.
The product department with the largest average waste value in units was eggs. This seems reasonable, since eggs are incredibly fragile and prone to breakage. Next (with an average waste value reduced by a factor of ~½) was fresh bread and donuts. Given the very short shelf life of these items, this seems reasonable.
The waste metric has the potential to help suppliers track the waste of product as it moves through the retail chain. To validate the metric’s accuracy, our team’s next step is to compare the results of our computation against the test retailer’s actual recorded storage reports. If those figures are sufficiently similar to one another, we will move forward with implementing a waste metric for retailers that do not provide such information.
By making this data accessible through the Crisp Data Platform, we aim to help customers identify and prevent possible waste incidents. For example, we hypothesize that overestimates of sales volume could lead to an increase in waste several time periods later as products expire and are removed from the shelf. If we are able to identify these leading indicators of waste, we can help customers recover goods before they expire. Empowered with the information that excess product is present in their inventory, brands could take steps (such as running a promotional campaign) to ensure that inventory does not expire on the shelf. Retailers could also use this information to donate excess inventory to food recovery organizations. As we obtain data for more customers and retailers, we can also derive statistical estimates of waste trends across retailers and product categories over time, providing lessons learned for the industry as a whole.
If you are interested in keeping up with Crisp’s work to reduce food waste, subscribe to the blog, or contact us for a demo of our business insights dashboard.