


Supercharge CPG sales with AI-powered ...
May 29, 2025
Crisp Product Manager Jordon White shares a roundup of this month’s updates to the Crisp data platform.
Here at Crisp, our goal is not just to show you interesting insights, but to help you take action that will drive your business forward. That’s why this month, you’ll find new dashboards to detect distributor voids, identify year-over-year sales trends, get actionable insights for new retailers, and export data into your core tools. Read on for more about this month’s product updates.
Voids affect distribution and hurt sales, but they can be difficult for brands to identify. That’s why Crisp developed a Retailer Voids Dashboard, which detects and surfaces likely voids across retailers. Our latest release, the Distributor Voids Dashboard, uses that same technology to help you pinpoint re-ordering or out-of-stock issues across distribution channels.
Crisp’s proprietary voids detection model uses machine learning to identify where a product should be selling, but isn’t. We reference 13 different data points, including current and historical sales data from multiple nearby stores and products, to make predictions. The Distributor Voids Dashboard helps you drill down to investigate problem areas and follow up with distributor partners to get products selling again.
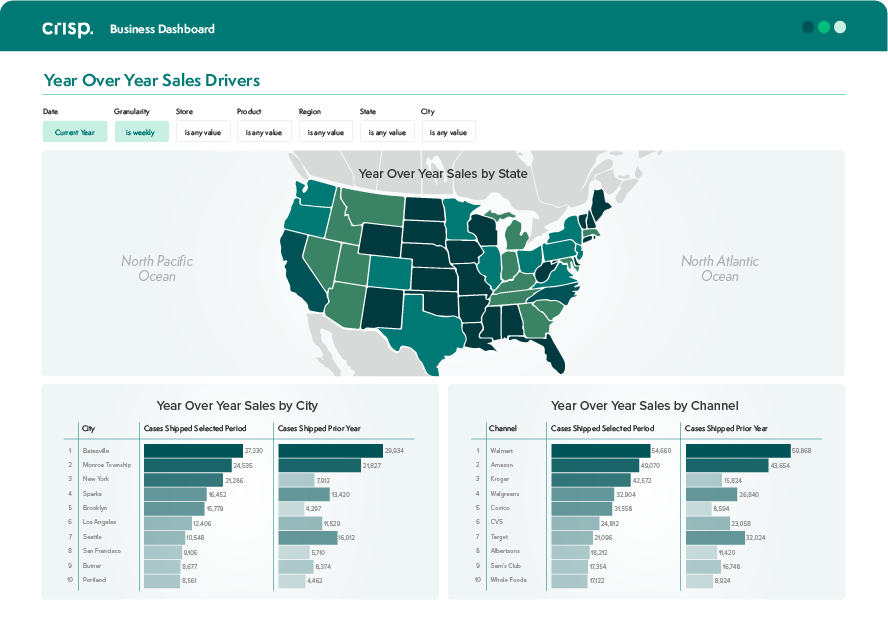
Year-Over-Year Sales Dashboards help brands understand business performance and market trends by comparing current sales patterns to similar periods in previous years. With new dashboards for KeHe, Kroger, Wegmans, Target, SVHarbor, and 8 other connectors, you can compare YOY data for time periods ranging from two weeks to a year. Once you’ve found a relevant trend, you can easily click to filter down to a specific channel, retailer, distributor, or region to identify drivers of the YOY change. From there, you can take specific action using store and product level performance data, and export store lists to follow up on relevant insights.
Crisp’s new Core Dashboards make it easy for Lowe’s and The Home Depot suppliers to understand their sales, distribution, and velocity data. With Crisp’s dashboards, customers can track high-level trends, drill into details by store or product, and export detailed store lists to follow up with brokers or buyers and keep sales moving along the supply chain.
Certain data from the SVHarbor portal is available only at the chain level. To offer insights into these locations, we’ve created a separate Specialty Chain Sales Dashboard, now available to all customers with an SVHarbor connector.
Crisp’s newest Outbound Connector syncs distributor and retailer data securely to Azure Data Lake Storage. This update enables you to sync data from Crisp to power analytics with platforms like Azure Synapse Analytics, Power BI and Data Factory. Now, the latest retail data will be automatically synced to your Azure environment to help you get reliable insights faster.
Customers interested in exporting Crisp data via an OData connection can now find a dedicated OData Outbound Connector in Crisp’s catalog. Crisp already uses this OData API to connect to Excel, Power BI, and Tableau, but you can now use the generic OData API to connect Crisp data to additional systems you may use, such as an on-premise SQL server.
Ready see how Crisp’s new tools and features can help your business? Contact us today for a demo.
To keep up with our product updates and data best practices, subscribe to the Crisp blog.