


Supercharge CPG sales with AI-powered ...
May 29, 2025
Data normalization must be completed in real time for CPG companies to use it to their full advantage. Engineer Mihir Pande breaks down how Crisp normalizes retail data from multiple sources.
Data normalization is an integral, but complex aspect of measuring CPG business health. Brands need to know how they’re doing at all their various retailers and distributors in order to make data-driven decisions – but as any CPG brand knows, collecting, organizing, and understanding this information is no easy task.
Sifting through uniquely-structured retailer datasets and reorganizing the data into a usable format on an ongoing basis takes tremendous effort. For many companies, normalizing data either takes a large team, an expensive data scientist, or…it doesn’t get completed at all. In this article, we’ll explain how Crisp streamlines data normalization, and how CPG brands are using this automation to find important insights, from high-level trends down to store-level details.
Here’s what we’re going to talk about, with real-life examples:
By the end of this article, you’ll gain a deeper understanding of the exact data normalization method CPG brands are using to make timely, data-driven decisions while saving time and resources.
Database normalization is a technique for creating databases from multiple source datasets with inconsistent structures. Normalization creates a predictable outcome by removing anomalies, duplications and errors, and organizes data into dimension and fact tables with standardized column values. Put simply, it brings all that disparate data together and makes it more useful.
Once datasets arrive from various retailers in their unique formatting and systems, they need to be re-organized into one coherent system. This end result allows anyone in the company to analyze the business as a whole. For example, they can:
Before companies can take these actions, problems must be eliminated that cloud the data from showing a complete, accurate picture. Here are the issues proper data normalization resolves:
If your company is normalizing data on its own, you’re probably familiar with the challenges of organizing multiple weekly reports in a timely manner to apply to decision-making. And if you’re not taking this step, you have probably doubted the reliability of your data when making decisions.
Here are the top issues that companies face with data normalization:
Here’s how this often looks in the real world. Take a granola bar company that sells at Whole Foods, Target, and Dollar Tree locations across the country. Each retailer makes the brand’s data available in a portal including sales, pricing, promotions, and inventory. The problem: while Whole Foods uses a 5-digit format for store location zip codes, Target uses a 9-digit format, while Dollar Tree uses a 2-line format. There’s no consistency across the reports, disabling any quick analysis across stores or regions unless someone goes in and manually inputs everything into their own, consolidated system.
Another tricky issue pops up when a brand doesn’t know which store a report line is referring to, or if a store closes. As time goes on and stores close or reopen, the weekly reports change. Many brands find this process of realigning locations in the data overwhelming, particularly smaller companies with less personnel to comb through it all.
Crisp ingests all the original data from retailer and distribution portals, and transforms it into organized tables with a logical system prepped for database storage, reporting and analysis, and modeling.
At a high-level, normalization follows these core steps:
Here’s a deeper look at the data steps our normalization engineers take to turn disparate data sources into a single source of truth.
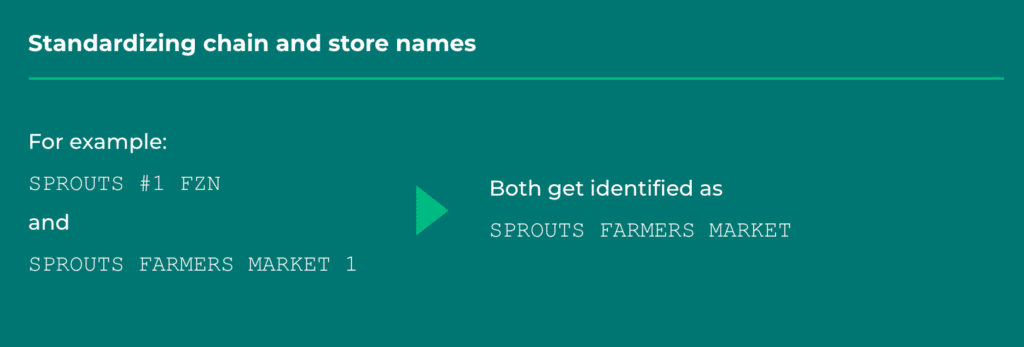
The first step is cleaning up inconsistencies in the data. This prepares our system to later organize the information with specific rules and formatting as it places each piece of data into tables or visualizations.
Here are some of the ways Crisp cleans data:
Cleaning as the first step means that brands can reliably access both per-retailer and cross-retailer data.
The staging step is where the data transformation happens. Deduplication is a major part of this step, and staging modeling ensures that columns and factors look the same across all brands and retailers.
Using our granola bar brand example, let’s say Whole Foods provides data that five granola bars were sold October 1, while Target’s data says that one bar was sold at 10 am on October 1, another two were sold at 4 pm, and so on:
| Date | October 1 granola bar sales |
| Retailer: Whole Foods | 5 single, 1 pack of 10 |
| Retailer: Target | 2 bars sold at 10:25 am 20 bars sold at 4:12 pm 4 bars sold at 7:15 pm |
Because the time and date data from each source is not standardized, it must be aggregated and deduplicated to be put into standardized tables. So with this example, we would aggregate to show the total sales for the granola bar in that store on a single day:
| Date | October 1 granola bar sales |
| Retailer: Whole Foods | 15 |
| Retailer: Target | 26 |
Deduplication is necessary because retailer reports can change drastically from one week to the next. Take the example of Whole Foods opening a group of new stores in one region, and breaking up the region into two separate ones.
Brands shouldn’t have to worry every time a shift like this occurs – they just need a list of stores where they can sell. So, here’s what Crisp does:
Augmentation involves geocoding, which translates store locations into coordinates to enable mapping, visualizations, and more exact, accurate data.
This is a piece of information that’s really important for CPG brands, so they can better understand where they’re selling and shipping products.
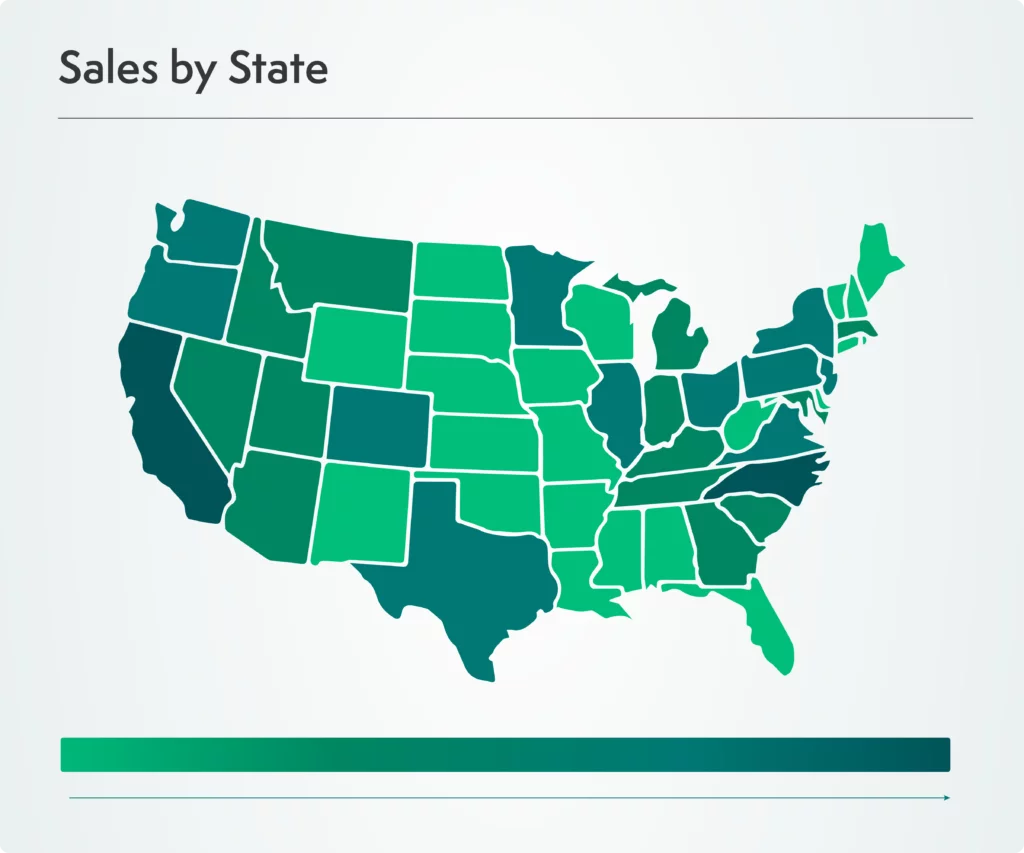
How does Crisp do this, when some store locations have incomplete data? We use our own store locator system and integrate census data to give the complete picture.
The documentation step is where we help brands understand what each data table is, how they can be used, and how all the tables interconnect with one another. It might not sound like much, but this is game-changing for brands digging into their CPG analysis.
Finally, the normalized data is sent through rigorous testing to make sure everything is correct. Then, the data is piped in real-time into Crisp dashboards or other tools of choice, like Snowflake, Excel and Power BI. The result? Seamless reporting and data that’s ready for analysis and presentation.
Crisp specializes in data normalization for CPG companies, and we know first hand how much of a difference it makes for brands when they start taking advantage of this process. To learn more, contact us today for a demo. To keep up with other industry insights and best practices, subscribe to the blog.