

KeHE data operations guide for CPGs
How to use KeHE Connect data to grow your distribution
KeHE Connect is the supplier portal where CPG brands access their sales, inventory, and distribution data across KeHE’s network of 19 distribution centers. For the thousands of suppliers who sell through KeHE, this data is the foundation of every distribution decision – from adjusting purchase orders to preparing for a buyer meeting.
But accessing data and actually using it are two different things. The brands that grow fastest with KeHE are the ones that build daily habits around their distribution data – tracking velocity, monitoring DC inventory, resolving out-of-stocks before they compound, and feeding clean data into their analytics tools. This guide covers the data available through KeHE Connect, the use cases that drive real results, and how to structure your data so it’s ready for whatever comes next.
Your KeHE data, ready to act on every day
Accessing data and actually using it are two different things. The brands that grow fastest with KeHE are the ones that build daily habits around their distribution data – tracking velocity, monitoring DC inventory, resolving out-of-stocks before they compound, and feeding clean data into their analytics tools.
What data is available through KeHE Connect?
KeHE Connect gives suppliers access to several core data sets that together paint a full picture of how products move through distribution:
Sales Data – Daily sales at the DC, SKU, and store level. This is the baseline for understanding what’s selling, where, and how fast. Suppliers can track trends over time, compare performance across regions, and identify which products are gaining or losing traction. Pairing this with year-over-year comparisons makes it easier to tell a growth story in buyer conversations.
DC Inventory – On-hand inventory across KeHE’s distribution center network, showing stock levels by SKU and location. This is how suppliers spot when a DC is running low before products go out of stock. Brands that monitor DC inventory daily can adjust purchase orders proactively rather than reacting to missed sales.
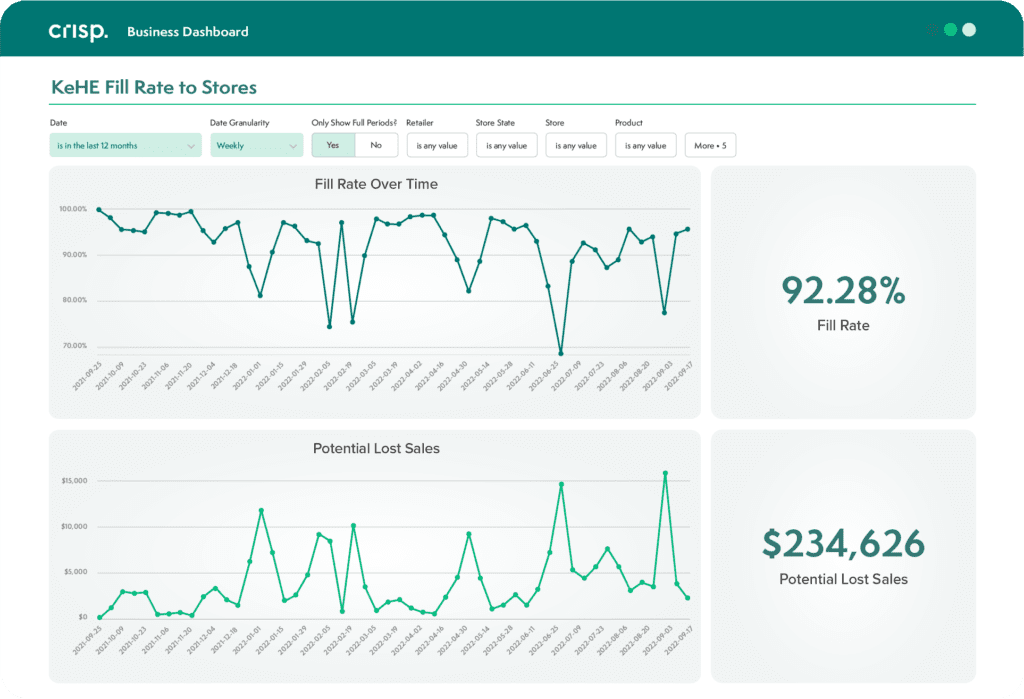
Fill Rate – The percentage of product that shipped versus what was ordered, with potential lost sales calculated in dollars. Fill rate is one of the most important operational metrics for any distributor relationship – it tells you how reliably you’re getting product where it needs to go. Understanding where fill rate is low can help identify locations where shipping issues need investigation.
Distribution – Points of distribution (PODs) data showing which DCs carry your products and how your distribution footprint is expanding or contracting over time. This is the data suppliers use to optimize their assortment strategy and make the case for adding new products or entering new regions.
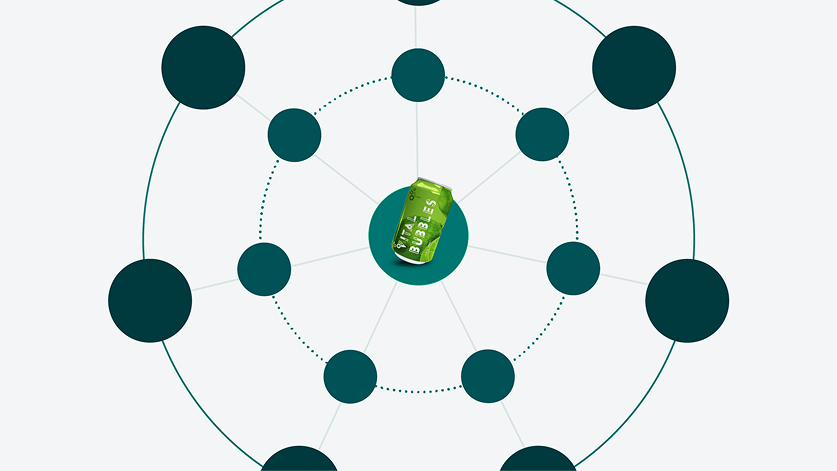
Distribution data helps suppliers optimize their assortment strategy and make the case for adding new products or entering new regions.
How suppliers use KeHE data to spot and resolve out-of-stocks
Out-of-stocks at a distribution center don’t just mean a missed sale – they can trigger a void that erodes distribution over time. When product isn’t available at a DC, retailers may stop ordering it, and what started as a short-term supply issue becomes a permanent loss of shelf space.
The most effective KeHE suppliers designate time each week to review inventory levels across DCs, identify products running low, and take action before stock-outs occur. Crisp’s KeHE inventory dashboards make this process faster by surfacing low-stock situations and flagging DCs where inventory is too low to support upcoming demand.
Carbone Fine Food uses Crisp’s KeHE dashboards to track out-of-stocks and make the case for larger purchase orders. By improving inventory flow and keeping shelves stocked, the team has boosted fill rate by 10% and saved an estimated $500K in avoided stock-outs.
It’s also worth watching for phantom inventory – situations where a DC’s system shows product in stock but it isn’t actually available. Phantom inventory blocks replenishment because the system doesn’t trigger a reorder. Comparing sales activity against inventory levels can help surface these discrepancies.
Carbone Fine Food uses Crisp’s KeHE dashboards to track out-of-stocks and make the case for larger purchase orders. By improving inventory flow and keeping shelves stocked, the team has boosted fill rate by 10% and saved an estimated $500K in avoided stock-outs.
How suppliers use KeHE data to prove velocity and win placements
Distributors and retailers think in terms of how fast products move. Sales velocity – units sold per store per week – is the metric that determines whether your products earn more shelf space, enter new DCs, or get promotional support.
KeHE Connect data gives suppliers the raw inputs to calculate and communicate velocity. But the real value comes from analyzing velocity at a granular level – by SKU, by DC, by region – to identify where products are performing well and where there’s room to push harder.
Brew Dr. Kombucha used Crisp to analyze KeHE velocity data and identify regional growth opportunities. The result: 30% year-over-year KeHE sales growth and a 41% increase in points of distribution. Core SKUs like Clear Mind, Superberry, and Island Mango all saw double-digit YOY growth, and the team successfully launched new flavors into Sprouts with nearly 1,000 PODs.
When walking into a buyer meeting, having velocity data at the store level – not just topline numbers – demonstrates that you understand your own business and can speak to performance in the regions and accounts the buyer cares about. Read more about how to bring data to buyer conversations.
Brew Dr. Kombucha used Crisp to analyze KeHE velocity data and identify regional growth opportunities. The result: 30% year-over-year KeHE sales growth and a 41% increase in points of distribution.
Case studies: Real KeHE ROI

Brew Dr.
30% YOY KeHE growth

Safe Catch
Recovered $1M in stockouts

Nature’s Bakery
75% time-savings on data analysis
Chosen Foods
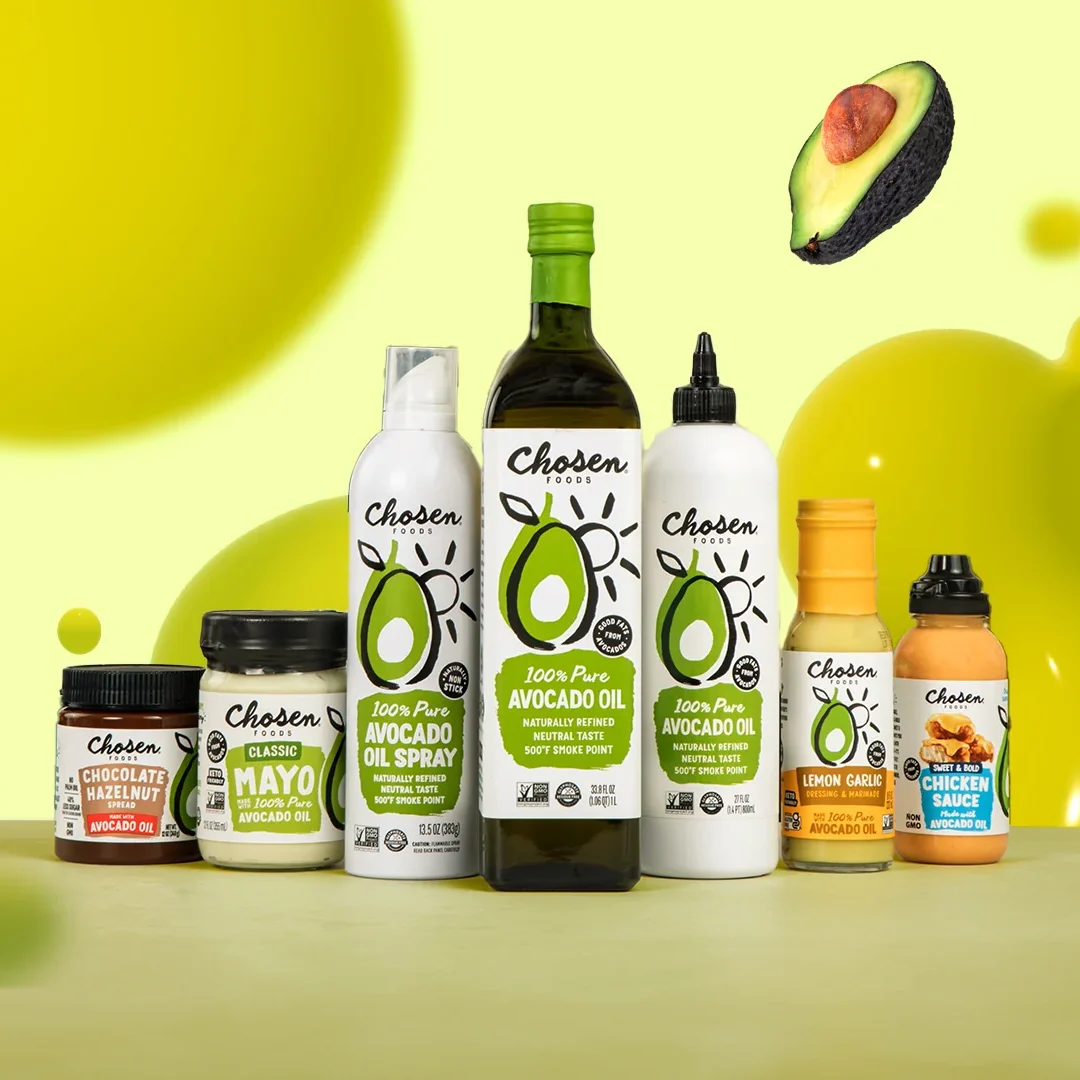
Eliminated spoilage throughout supply chain
How suppliers use KeHE data to manage fill rates and protect shelf space
Fill rate measures how much product shipped versus how much was ordered – and it’s one of the first things KeHE’s buyer teams look at when evaluating supplier performance. A consistently low fill rate signals reliability problems, and it can cost you distribution.
The KeHE Fill Rate to Stores dashboard shows how much product was shipped compared to how much was ordered, making it straightforward to identify locations where fulfillment is falling short. Suppliers can filter by account to see which retailers or DCs are being underserved.
Improving fill rate often comes down to two things: better demand planning so you’re producing enough product, and closer monitoring of DC inventory so you’re shipping before stock runs out. Retailers like Target and Sprouts are increasingly measuring supplier performance through metrics like purchasability – whether a shopper can actually complete a purchase of your product – and fill rate is a direct input to that score.
Nature’s Bakery uses Crisp to filter KeHE data by account and turn it into an action plan. “Crisp gives us real-time intelligence to refine our orders and respond quickly as inventory moves through the market,” says Adriane Walters, Director of Grocery Sales. “Filtering by account, I get an action plan for the customers I need to call on.” The result: 75% time-savings on data analysis and clearer buyer conversations.
“Crisp gives us real-time intelligence to refine our orders and respond quickly as inventory moves through the market. Filtering by account, I get an action plan for the customers I need to call on.”
Adriane Walters, Director of Grocery Sales, Nature’s Bakery
Making your KeHE data AI-ready
Clean distribution data is the foundation for any advanced analytics – and that includes AI. Whether your team is running models in Snowflake, building dashboards in Power BI, or exploring AI-powered forecasting, the quality of the output depends on the quality of the input.
Making your KeHE data AI-ready starts with structure. When KeHE Connect data flows through Crisp, it’s normalized into a standard format that’s consistent across retailers and distributors. This means a query about sales velocity at KeHE uses the same data structure as a query about velocity at UNFI or Whole Foods – no manual cleanup required.
The second piece is product data. When the same product is classified differently across KeHE, UNFI, and your retail accounts – different descriptions, missing attributes, mismatched UPCs – it creates noise that undermines any analysis. Crisp AI Master Data helps suppliers standardize product attributes, classifications, and hierarchies across every channel, so reports are accurate and category management conversations are grounded in consistent data.
The goal isn’t to add AI for its own sake. It’s to structure your KeHE data so it flows cleanly into whatever tools your team uses to make decisions – whether that’s a retail analytics dashboard, a demand model, or a cross-channel report. Clean, connected, standardized data is what makes all of that work.
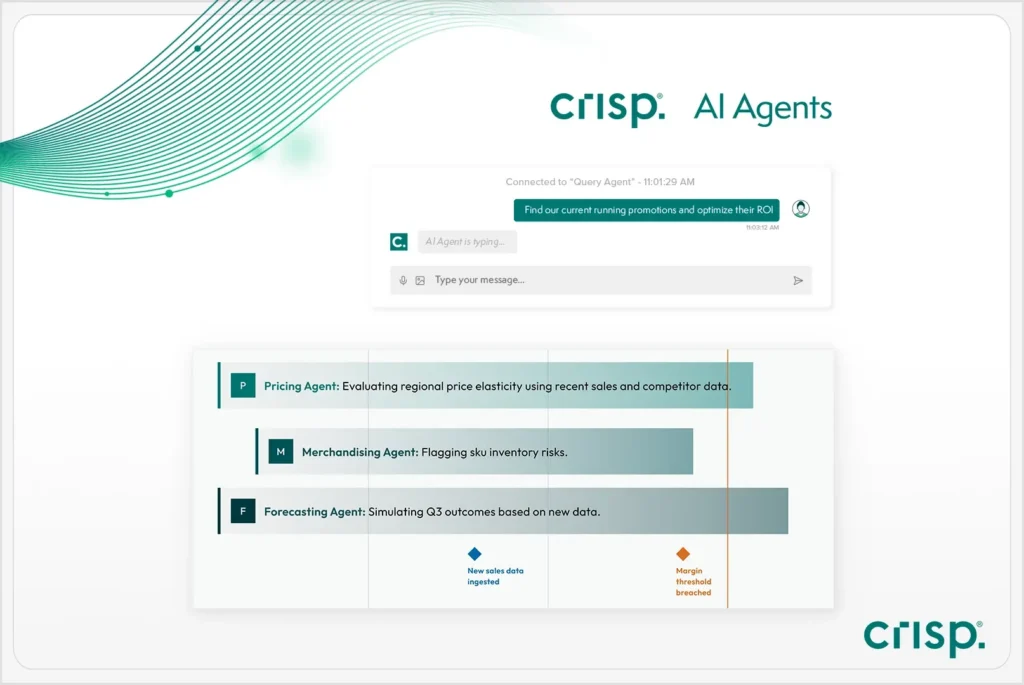
Discover Crisp AI Agents for Retail
How to connect KeHE data to the rest of your retail business
KeHE Connect data is valuable on its own, but most CPG brands don’t sell exclusively through KeHE. They sell through UNFI, through direct retail accounts like Whole Foods or Sprouts, and through e-commerce. When distribution data lives in separate portals for each partner, it’s difficult to get a unified view of the business.
Crisp connects directly to KeHE Connect and delivers clean, structured data through interactive dashboards – or into the BI tools and cloud platforms your team already uses, including Excel, Power BI, Snowflake, Databricks, and more. This means your KeHE sales, inventory, and fill rate data can sit alongside data from every other retailer and distributor in one place.
Brew Dr.’s Sales Planning Manager, Alyssa Domek, describes the value: “With Crisp, we get a holistic view of what’s going on with our business by seeing our granular data visually, all in one spot.”
For brands that work with both KeHE and UNFI, consolidating distribution data into a single analytics platform eliminates the time spent logging into separate portals, pulling the same reports in different formats, and manually reconciling numbers. It also makes cross-distributor analysis possible – comparing performance across KeHE and UNFI by product, region, or retailer.
Getting more from your KeHE partnership with data
KeHE suppliers who treat their distribution data as a daily operational tool – not something they check quarterly – consistently outperform. They catch out-of-stocks before they compound. They walk into buyer meetings with velocity data at the store level. They monitor fill rates and adjust purchase orders before problems erode their distribution gains.
And by connecting KeHE data to the rest of their retail business through Crisp, they save time, eliminate manual report-pulling, and build a data foundation that’s ready for whatever analytical tools or AI capabilities come next. To see how Crisp connects directly to KeHE Connect, visit our KeHE page.
Get insights from your retail data
Crisp connects, normalizes, and analyzes disparate retail data sources, providing CPG brands with up-to-date, actionable insights to grow their business.