













Evaluating demand forecasting solutions for CPGs
Phantom inventory is one of the quietest drivers of lost sales in retail. When a store’s systems show a product as available but the shelf is empty, your forecast can’t tell the difference between no demand and no supply. The problem starts with the data most forecasts are built on: shipment history. Shipments capture only the volume that left your warehouse, which rarely matches what shoppers actually wanted to buy.
Supply chain and category teams invest in forecasting platforms to recover those lost sales and free up working capital. Yet many platforms stall at a monthly national curve that no planner trusts for replenishment. The right platform goes beyond shipment data to estimate true demand: what you could sell if availability were unlimited. As you evaluate vendors, weigh each one on its ability to turn granular, daily retail data into a signal your planners can act on – without burying them in manual reconciliation.
Key takeaways
- Ask how the vendor measures forecast accuracy at the SKU and store level. Division or national averages look clean because regional errors cancel out, while you lose sales in both directions.
- Get a straight answer on data refresh cycles. Genuine demand sensing needs daily sales and inventory data from retailer portals and distributor feeds, synced back to your supply chain and planning systems with minimal latency.
- Confirm the platform speaks the metrics that drive CPG execution: on-shelf availability (OSA/WIP%), same-store sales velocity, digital purchasability for omnichannel, and store-level weeks of supply.
- Forecasts are only as good as the data and the explanations behind them. Look for AI-ready, harmonized data and agentic workflows that show the “why” behind each number.
To choose retail demand forecasting software, start with the workflow your team needs to improve, confirm which data sources the platform can connect to, evaluate how products are matched and governed, test whether analytics explain performance changes, and measure whether recommendations can translate into planning, execution, and buyer conversations.
Why most retail forecasting approaches fall short
Spreadsheets and stale monthly reports hide demand patterns at the store level. The resulting forecast flattens out the real differences between stores, so CPG teams compensate by ordering safety stock everywhere, then pay for it later in expedited freight and markdowns.
The root issue is that the data arrives late, and it arrives differently from every retailer. CPG teams often learn what’s happening at the shelf through delayed syndicated reports or a patchwork of retailer portals, each running on its own schedule.
The lag creates two problems. First, it blurs the signal: a sales dip could mean falling demand, or it could just mean the product wasn’t on the shelf. Second, it compounds itself. Feed a forecast a zero caused by a stockout, and it’ll keep underforecasting that item long after the shelf is fixed. Assortment changes make it worse. New items get lumped into a national average, and promotions often aren’t entered into the system until after they’ve already started, because no one keeps the trade calendar as clean, structured data the forecast can actually use. The result is a forecast that looks fine on paper but that no planner actually trusts enough to place an order against.
Building a forecast you can trust starts with something simple: a clean, daily, store-level demand signal, and a clear definition of what each data feed actually means. AI changes what’s possible here, but only once that foundation is in place.
Before you sign up for a demo, know what to look for.
Building a forecast you can trust starts with something simple: a clean, daily, store-level demand signal, and a clear definition of what each data feed actually means. AI changes what’s possible here, but only once that foundation is in place.
What should vendors share in a demo?
A clean sample workflow doesn’t tell you much. Push every vendor through the same mess your team handles every week: late feeds, retailer-specific item IDs, shifting hierarchies, promotions, stockouts, slow movers, and the exceptions that still need a human to sign off. Here are the 7 things every vendor should be able to prove, live, on real data.
| Evaluation Area | What to make the vendor prove |
| Data quality and refresh | Show exactly how the platform ingests, cleans, harmonizes, and refreshes retailer, distributor, POS, inventory, and promotion data, and how fast. |
| Product attribution and governance | Show how the platform connects retailer item IDs, syndicated records, distributor records, and your internal product definitions, and who approves or rolls back a mapping change. |
| Forecast granularity | Prove the platform forecasts at the SKU-store level and reconciles cleanly up to DC, banner, region, and national views. |
| Retail context | Show how the model separates true demand from stockouts, zero sales, and phantom inventory, and how it accounts for promotions, holidays, weather, and other local demand drivers. |
| Accuracy testing | Backtest against your historical data and compare results to a simple baseline, by item, store, retailer, and forecast horizon. |
| Outputs and workflow fit | Show probabilistic forecasts, prioritized exceptions, and recommendations that land in the tools your team already uses. |
| AI explainability and business impact | Show why a recommendation was made, which signals shaped it, and how forecast improvements connect back to business outcomes. |
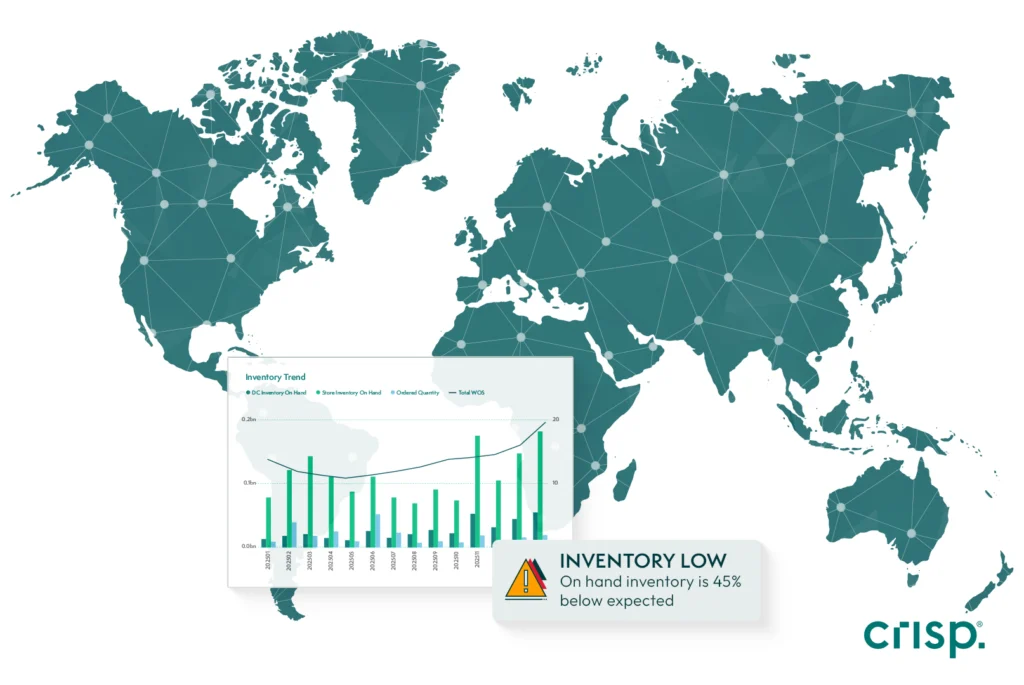
Discover Crisp AI Agents for Supply Chain teams
How does the platform forecast at the SKU-store level, and reconcilee cleanly up to DC, banner, region, and national views?
Core retail technology capabilities to look for
Not every “AI forecasting” platform does the same work under the hood. Before you get into demos, understand what actually matters in retail demand forecasting: trusted data, forecasts that hold together from store-level detail to higher-level planning views, models that account for promotions and outside factors, and outputs planners can actually act on.
A harmonized, AI-ready data foundation
A forecasting model can’t fix bad data. The flaws in the input just get repeated at scale. Point-of-sale, inventory adjustments, returns, and inbound shipments need to land in one timeline with consistent item and store identities. Ask how the vendor harmonizes retailer and distributor feeds into a single source of truth – this is the same retail master data management problem that trips up reporting everywhere else in the business.
AI earns its keep here. Agent-led data enrichment can take feeds that are “80 percent clean” and push them toward true completeness, labeling outliers, reviving stale fields, and clustering stores by attributes like climate or format. A clean, semantic data layer is the prerequisite for any AI forecast you intend to trust.
Forecasts that reconcile across DCs and banners
Forecasts should reconcile cleanly across DCs and banners, so a store’s numbers roll up to a consistent total. Store-level forecasting should show where demand is changing before those patterns disappear into a national number. Ask how the platform models slow movers that mostly sell zeros, and how it forecasts new items that launch without sales history.
Promotions, price, and external demand influencers
Promotions shouldn’t just show up as unexplained spikes in the sales history. A serious platform tags them as structured events with a start date, end date, mechanic, and expected lift, so the model knows why demand moved. Separating base demand from incremental lift keeps a single BOGO event from inflating next year’s baseline forecast, and a lift coefficient lets you apply what past promotions actually did. Ask how price changes and displays enter the model, and whether planners can simulate lift before committing inventory. For grocery and convenience, daily models should also factor in external demand influencers like holidays, weather, local events, and school schedules.
Probabilistic forecasts tied to in-stock targets
Point forecasts alone push planners to pad inventory. Ask for probabilistic outputs, a forecast range rather than a single line, with safety-stock recommendations tied to an explicit in-stock target, and check how those outputs connect to replenishment rules.
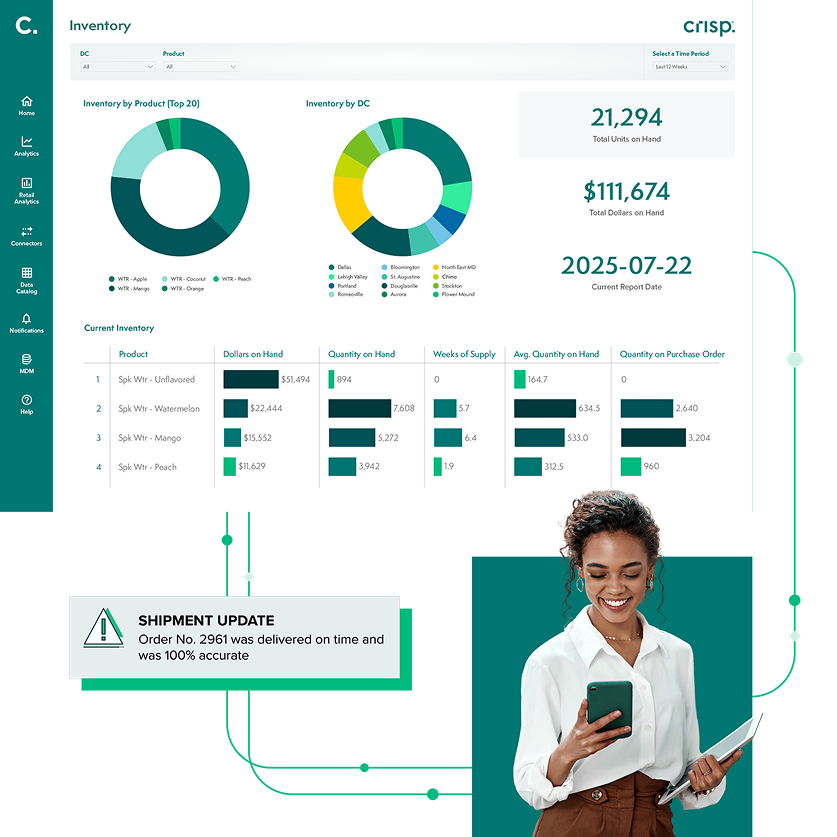
Grow retail revenue with real-time data
Promotions shouldn’t just show up as unexplained spikes in the sales history. Separating base demand from incremental lift keeps a single BOGO event from inflating next year’s baseline forecast.
The metrics that should anchor your evaluation
How you measure success shapes how your team behaves. Two metrics tell you whether a forecast is translating into results: velocity and availability.
Same-store sales velocity reveals the true demand trend. Unlike total sales, which rise and fall with distribution changes, velocity isolates how well products move in established stores. When velocity climbs, you know consumer demand is genuinely strengthening, which gives you confidence to forecast higher volumes.
On-shelf availability – often called walk-in purchasability (WIP%) – tells you whether you’re capturing that demand. A perfect forecast is worthless if the item isn’t buyable when a shopper reaches for it. Read together, the two metrics complete the picture: if velocity is strong but WIP% is low, you’re leaving sales on the table. If WIP% is high but velocity is falling, you may be overstocked.
Increasingly, availability extends beyond the physical shelf. Digital purchasability, sometimes called digital transactability, measures whether items are truly buyable online. That means not just listed, but visible, shoppable, and fulfillable across pickup and delivery. For omnichannel brands, ask whether the platform reports that same digital purchasability metric alongside in-store WIP%, and whether it can trace why an item stopped transacting, from publishing errors to broken variant mapping.
Behind any drop in these metrics is a root cause. The strongest platforms surface the two most common failure signals directly. Zero sales flags stores where an item should be selling but isn’t, pointing to misplaced product or early out-of-stocks. Phantom inventory reveals when systems show stock on hand but sales have stopped.
Digital purchasability, sometimes called digital transactability, measures whether items are truly buyable online. That means not just listed, but visible, shoppable, and fulfillable across pickup and delivery.
When distributor data and your P&L do not line up
Complex distribution can bring SKUs and brands under one vendor number, which makes division-level forecasting look noisy for reasons that have nothing to do with demand. In those cases, master alignment and filtering matter as much as the model family. Nestlé USA realigned distributor feeds to internal hierarchies so sales and supply chain groups could trust weeks-of-supply views at scale.
Use that pattern in demos. Ask how the platform enforces attribution rules, how it surfaces exceptions when a new SKU appears under the wrong code, and who can approve a mapping change without freezing the nightly batch.
Ask how the platform enforces attribution rules, how it surfaces exceptions when a new SKU appears under the wrong code, and who can approve a mapping change without freezing the nightly batch.
From forecast exceptions to the people who fix shelves
Forecasting and replenishment tools generate a lot of exceptions: flagged transfers, odd promo lifts, numbers that don’t match what a retail partner is seeing. Someone still has to decide what’s real and what to do about it. The platform you pick should make that decision easier for the people doing the work, not just hand them more alerts.
AI agents are built for exactly this kind of decision. Instead of treating every SKU the same way, they watch performance store by store and item by item, catch the ones drifting off pattern, and leave the rest alone. Strong platforms rank which stores need attention most, explain what’s likely causing the problem, and show their reasoning step by step, so a planner isn’t just told “WIP% is down”: they’re told where, why, and what to fix today.
When you evaluate this, don’t settle for a summary after the fact. Ask the vendor to show you the actual signals behind one live recommendation: which inputs moved the number, and how much each one mattered.
Also look for a closed loop: when a planner’s fix works, does that feedback actually train the model to catch similar issues faster next time? And ask how the vendor keeps autonomous actions in check. What guardrails are in place, and how does something as unstructured as a store manager’s note (“delivery was late again”) get turned into a signal the forecast can actually use?
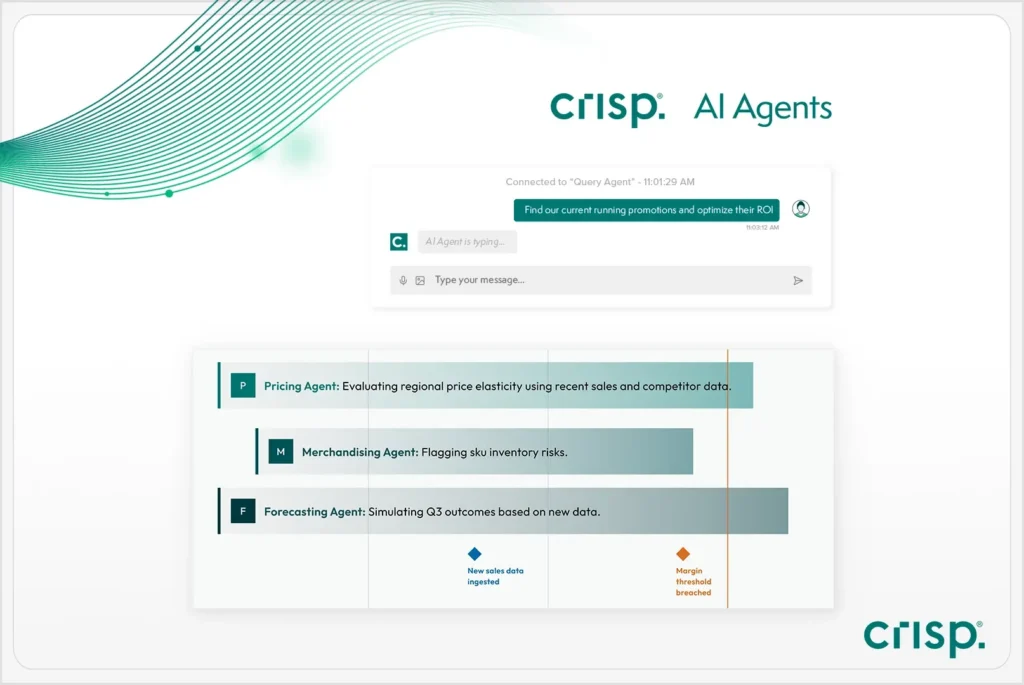
Discover Crisp AI Agents for Retail
Measuring outcomes
Hold vendors to retail and supply chain outcomes, not model accuracy in isolation. Once you have backtest results in hand, use them as your baseline for comparison across finalists, not just a pass/fail gate, but a reference point you revisit after go-live to confirm the model is holding up against real orders. Then track results across five areas:
- Forecast bias and weighted absolute percentage error at the SKU-store-week level, with pre-agreed horizons for each stage of a category’s life.
- Store-level in-stock, WIP%, and fill rate tied to the same item hierarchy the forecast uses, not a parallel report.
- Inventory turns and weeks of cover by category, paired with spoilage or markdown dollars where relevant.
- Forecast value add, if your team tracks planner lift against a statistical baseline.
- Latency: time from portal publication to modeled refresh, and the count of unmapped or dropped rows per week.
Concrete results help you benchmark what “good” looks like. Safe Catch used daily sales and inventory visibility to catch distribution gaps early and recovered more than $1M in lost sales tied to availability. Zuru leans on store-level data to send each store the right item mix and quantity. And in fresh categories, Dollar General scaled automated ordering across more than 7,000 stores, reducing perishable waste while fresh sales grew.
When your evaluation team compares finalists, test each one on a single messy week of your real data. Then check the exceptions it produces with merchandising, supply chain, and the retail account team. Do all three groups get the same explanation for what happened, or does each team hear something different?
AI Agents are not a sixth capability to check off the list. They are a layer that depends on the five capabilities above.
How Crisp approaches retail demand forecasting
Crisp brings daily, harmonized retail data together on the Crisp Data Platform, then layers applications on top: Crisp Retail Analytics for velocity, WIP%, and inventory trends, forecasting and order automation for SKU-store-level replenishment, and Crisp AI Agents to move teams from questions to recommended next steps.
Crisp AI Agents are built for retail workflows, not generic AI experimentation. They use daily intelligence across stores and SKUs to monitor performance, surface issues, recommend actions, and automate recurring analysis. Agents also show their work, grounding recommendations in defined business logic and a retail-specific semantic model so teams can understand why an answer was generated before they act on it.
If your team already uses a cloud warehouse or BI tool, Crisp can deliver standardized retail data into the systems you already work in, including Snowflake, Databricks, Power BI, and BigQuery. For planning, analytics, forecasting, and AI workflows to work well, they all need the same foundation: clean, current, harmonized retail data that shows what is happening across stores, SKUs, retailers, and distributors.
Every claim in this guide is one you can verify in your own environment, with your own retail feeds. If you’re ready to see it firsthand, talk to our team.
FAQs about buying retail forecasting software
-
How should we test a vendor on promotion handling without a six-month pilot?
Ask for a replay study on two past events per major category. The vendor ingests your history and promotion file, then shows forecast distributions and inventory recommendations for the weeks around each event. You’re looking for transparent inputs and a clear separation of base demand from lift, not a perfect curve.
-
What refresh latency is good enough for store-level grocery forecasting?
It depends on order cadence, but next-day refresh of item-store sales and inventory is a common bar for daily automated ordering. Fresh and perishable categories often need same-day updates; slower-turning center-store categories can tolerate more lag. Match the bar to the category, not a single company-wide standard.
-
How do we govern planner overrides without losing trust in the model?
Require an audit trail that ties each override to a reason code, horizon, and item scope, and reports override rate by planner and category. Good governance lets leadership reopen a single decision without rebuilding the entire hierarchy.
-
What is the biggest hidden failure mode after go-live?
Silent mapping churn – a retailer renames an item or swaps a vendor code, and the hierarchy breaks quietly. The forecast doesn’t error out; it just starts learning from the wrong history, and orders keep flowing on bad numbers until someone notices a shelf that doesn’t match the report. Ask for automated detection of those breaks and a quarantine rule that holds a SKU’s orders for review rather than shipping on stale logic.
-
What is the highest hidden cost in implementation?
The highest hidden cost is usually data reconciliation, which was treated as setup rather than a real workstream. Before implementation begins, ask what data the vendor needs, who will review product matches, how exceptions will be handled, and how match rates will be measured. That gives the team a clearer picture of the effort required before category strategy depends on the new foundation
Phantom inventory is one of the quietest drivers of lost sales in retail. When a store’s systems show a product as available but the shelf is empty, your forecast can’t tell the difference between no demand and no supply. The problem starts with the data most forecasts are built on: shipment history. Shipments capture only the volume that left your warehouse, which rarely matches what shoppers actually wanted to buy.
Supply chain and category teams invest in forecasting platforms to recover those lost sales and free up working capital. Yet many platforms stall at a monthly national curve that no planner trusts for replenishment. The right platform goes beyond shipment data to estimate true demand: what you could sell if availability were unlimited. As you evaluate vendors, weigh each one on its ability to turn granular, daily retail data into a signal your planners can act on – without burying them in manual reconciliation.A harmonized, AI-ready data foundation
Get insights from your retail data
Crisp connects, normalizes, and analyzes disparate retail data sources, providing CPG brands with up-to-date, actionable insights to grow their business.